US Dollar Price Analysis: DXY bulls and bears battle it out at a critical juncture
- DXY bears camped below 102.20 critical resistance.
- Bulls eye a break of the 50% mean reversion level to open risk to an upside correction.
The US Dollar was pressured on Thursday in non-directional markets but was weighed by US disinflationary data despite hawkish rhetoric from the Federal Reserve officials.
Technically, the US Dollar, as measured by the DXY index, is now at a crossroads as the following hourly chart will illustrate:
DXY H1 chart
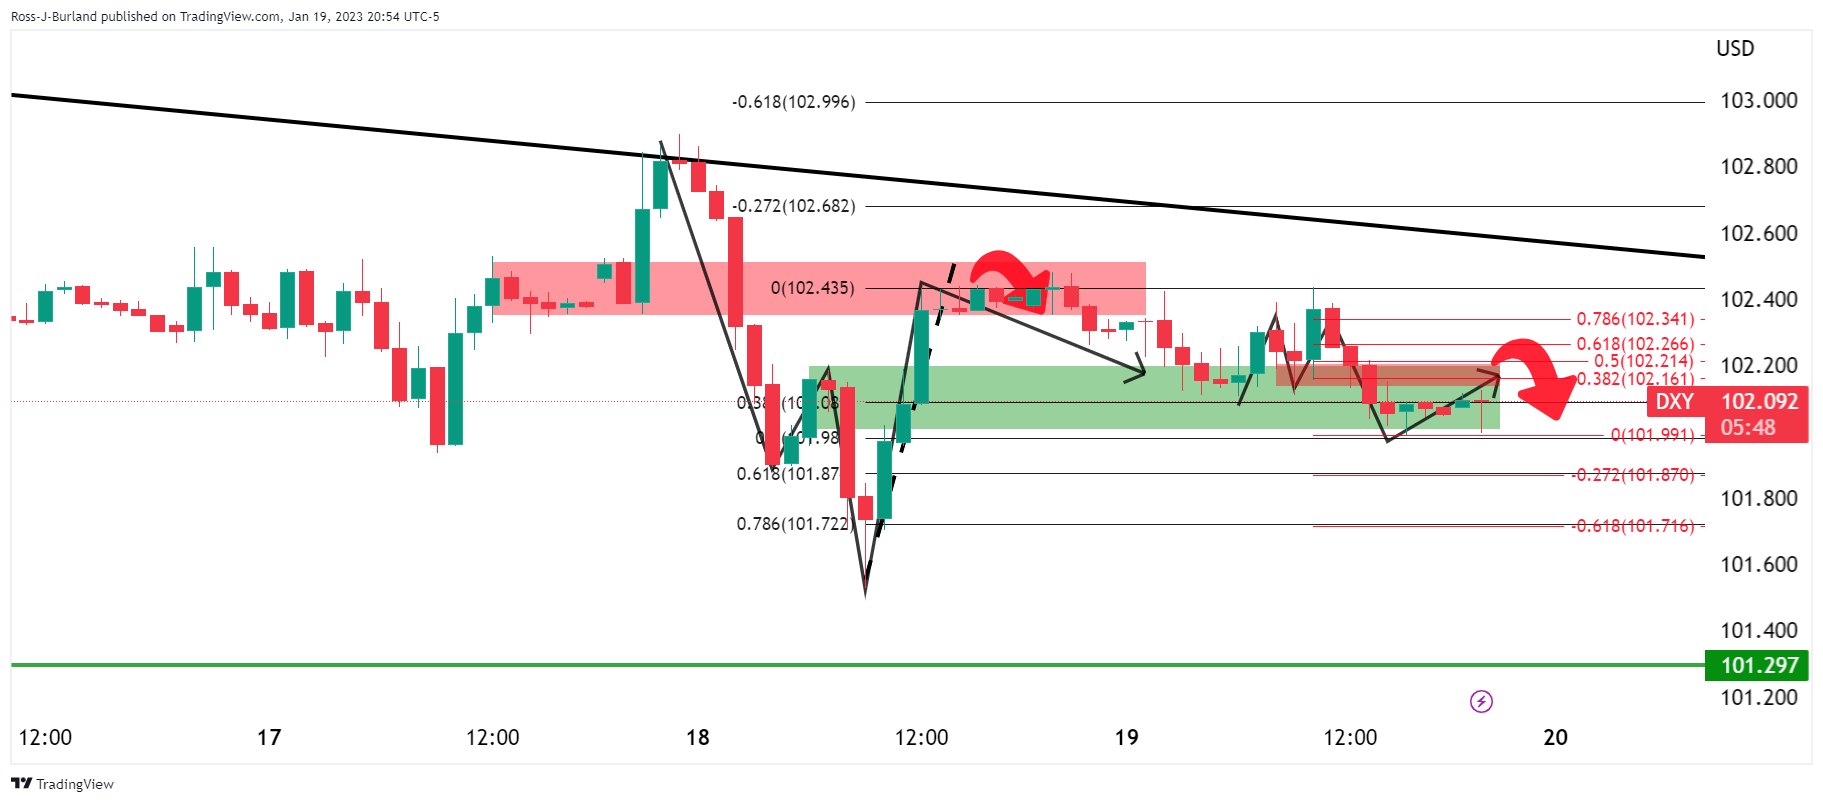
The price is bopping along the support with eyes on a test of the 38.2% Fibonacci level of the prior bearish impulse and a 50% mean reverison thereafter that meet the neckline of the M-formaiton. This resides at 102.20 and will be important for the development of the trajectory for the end of the week. A break there opens the risk of a move into the trendline resistance near 102.50 while failures open the risks of a significant downside continuation.
DXY daily chart
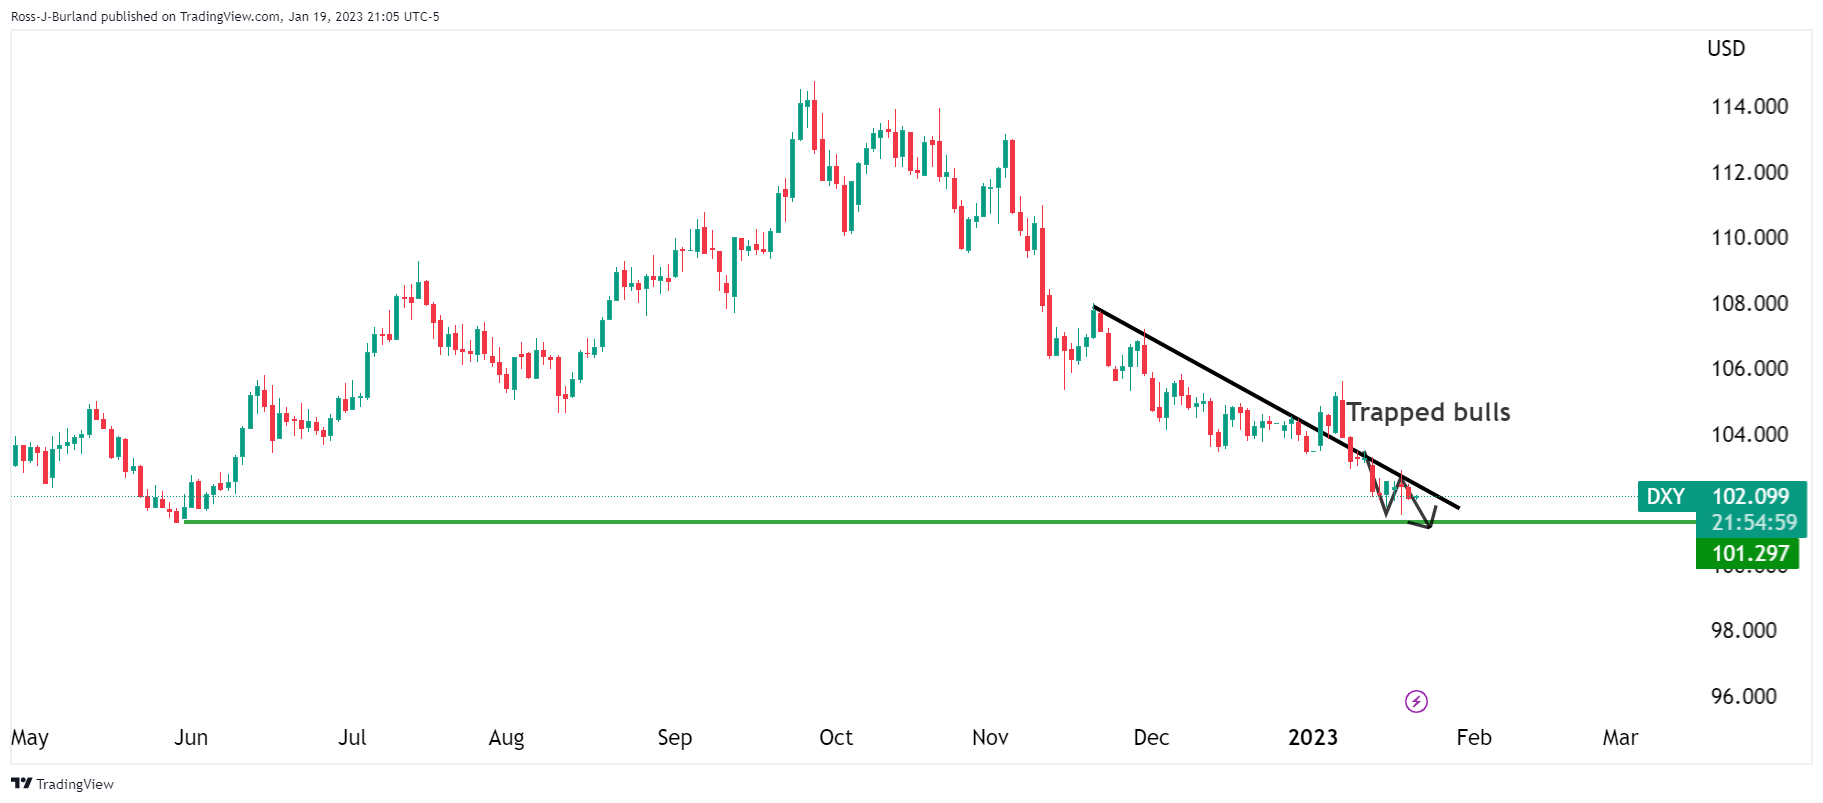
A move lower at this juncture opens risk of a break of the 101.30s swing lows as per the daily chart and the fake out that would have trapped US dollar bulls in the forex space.