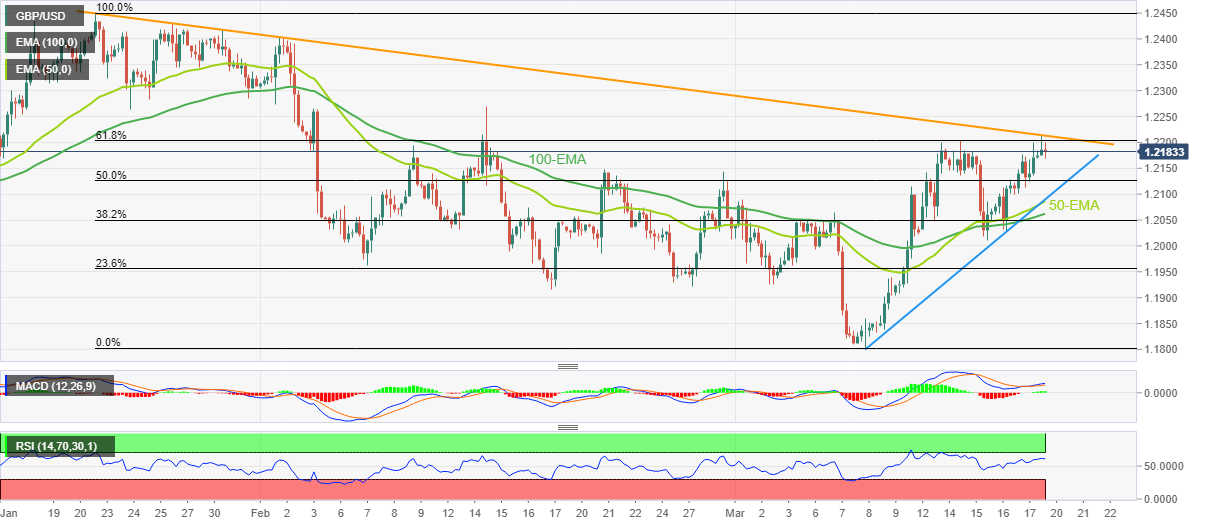
GBP/USD Price Analysis: Bulls step back from multi-day-old hurdle near 1.2210
- GBP/USD retreats from five-week high, stays mildly bid during three-day uptrend.
- 61.8% Fibonacci retracement, two-month-old resistance line challenge Cable buyers.
- Oscillators suggest receding strength in upside momentum but bears need validation from 100-EMA to retake control.
GBP/USD bulls take a breather around a five-week high, recently declining to 1.2185 as it reverses from the key resistance line during early Monday. Even so, the Cable pair remains mildly bid while printing a three-day winning streak.
That said, a downward-sloping resistance line from late January, around 1.2210 by the press time, appears a tough nut to crack for the GBP/USD pair buyers amid nearly overbought RSI (14) and mildly bullish MACD signals.
Also acting as an upside hurdle is the 61.8% Fibonacci retracement level of the quote’s fall from late January to early March, around the 1.2200 round figure.
It should be noted that the mid-February top surrounding 1.2270 appears the last defense of the GBP/USD bears, a break of which could propel the Cable price towards the 2023 top marked in January around 1.2450.
On the flip side, the 50% Fibonacci retracement level of 1.2125 could lure intraday sellers of the GBP/USD pair but a convergence of the 50-EMA and one-week-old ascending support line, near 1.2085, appears a tough nut to crack for the bears to retake control.
Also acting as an important support is the 100-EMA level surrounding 1.2060, a break of which won’t hesitate to challenge multiple lows marked during late February, around 1.1930-20.
Overall, GBP/USD is likely to witness a pullback but the bears are far from retaking control.
GBP/USD: Four-hour chart

Trend: Pullback expected
