AUD/USD Price Analysis: Needs acceptance above 0.6700 for a fresh rally
- AUD/USD is consistently struggling for an acceptance above 0.6700.
- Solid Aussie Trade Balance data has improved the outlook for the Australian Dollar.
- AUD/USD is on the verge of delivering a breakout of the Inverted H&S pattern.
The AUD/USD pair is continuously facing barricades near the round-level resistance of 0.6700 in the Asian session. The Aussie asset remained in action on Thursday after upbeat Australian Trade Balance data.
The Australian Trade Balance data showed that exports of Australian goods to China hit A$19 billion ($12.71 billion) in March, a rise of 31% from a year earlier and piping the previous peak from mid-2021, as reported by Reuters. Also, the Trade Balance report showed that the Asian powerhouse ordered plenty of iron from the Australian steel industry and lowered barriers to thermal coal shipments amid growing diplomatic relations. This has improved the Australian Dollar outlook swiftly.
Meanwhile, the US Dollar Index (DXY) has corrected to near 101.36 as US banking jitters and debt ceiling issues are consistently weighing. Also, investors are cautious ahead of the United States Nonfarm Payrolls (NFP) data.
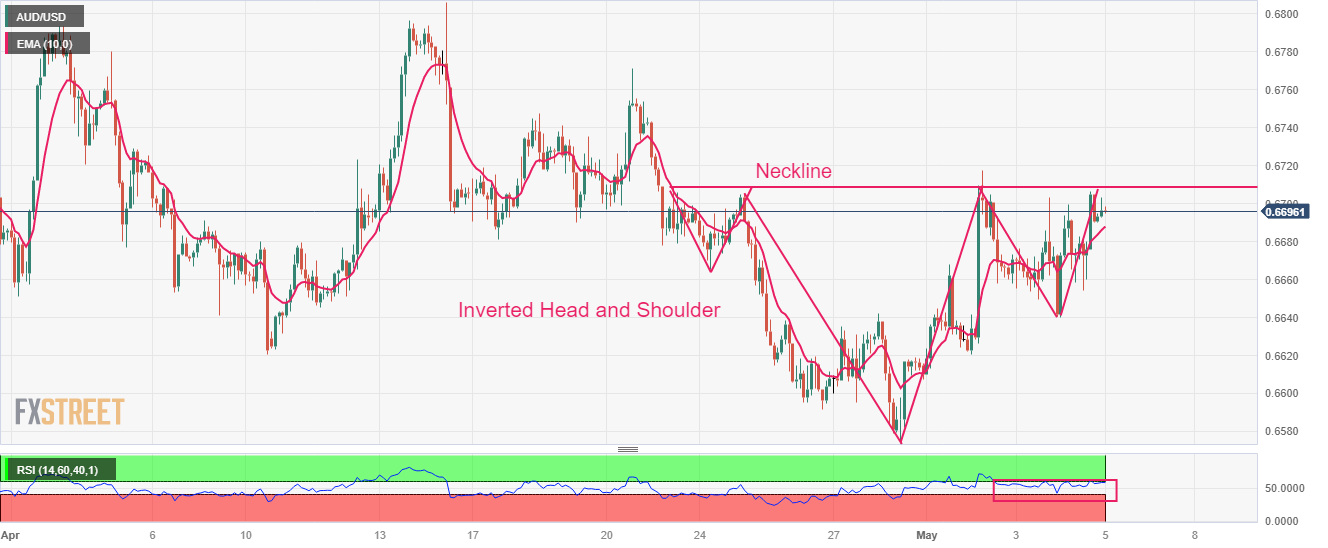
AUD/USD is on the verge of delivering a breakout of the Inverted Head and Shoulder (H&S) chart pattern formed on a two-hour scale. Usually, an inverted H&S formation indicates prolonged consolidation, and a breakout of the same results in a bullish reversal.
The 10-period Exponential Moving Average (EMA) at 0.6688 is providing cushion to the Aussie bulls.
Meanwhile, the Relative Strength Index (RSI) (14) is making efforts for shifting into the bullish range of 60.00-80.00. An occurrence of the same will activate the upside momentum.
Going forward, a confident move above My 02 high at 0.6717 will drive the Aussie asset toward April 20 high at 0.6771 followed by the round-level resistance at 0.6800.
In an alternate scenario, US Dollar bulls will flex their muscles if the Aussie asset will drop below March 15 low at 0.6590. An occurrence of the same will expose the asset to March 08 low at 0.6568 followed by 02 November 2022 high around 0.6500.
AUD/USD two-hour chart