Natural Gas Price Analysis: XNG/USD dribbles at multi-day top around $2.87 amid overbought RSI
- Natural Gas Price seesaws as bulls take a breather at the highest levels since March.
- Overbought RSI, looming bear cross on MACD suggests XNG/USD profit-booking.
- Previous resistance line, $2.70 support confluence challenge XNG/USD bears.
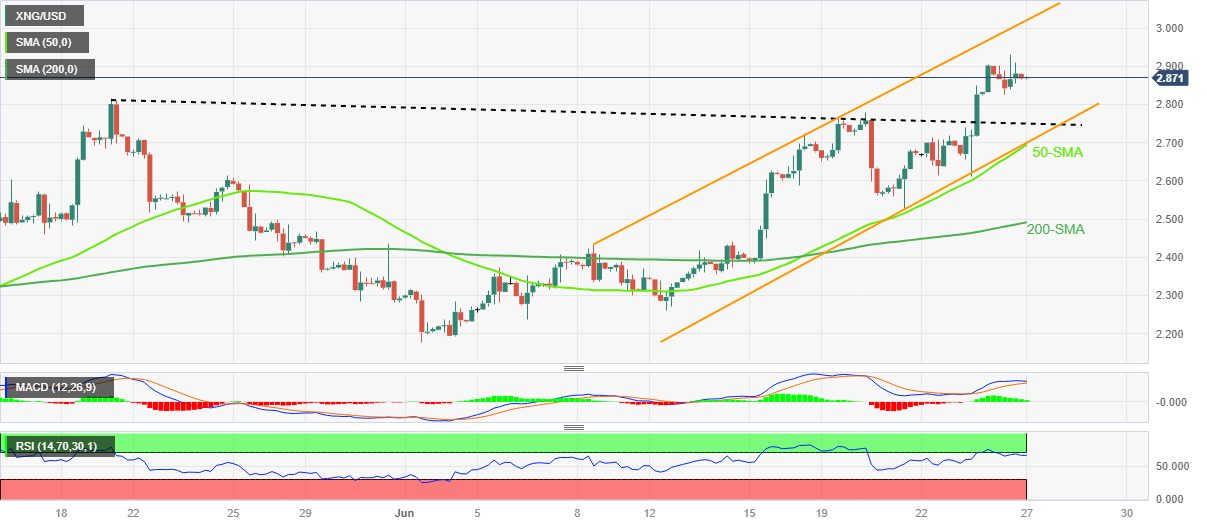
Natural Gas Price (XNG/USD) seesaws at the highest levels since early March, probing a four-day uptrend as it prints energy trader’s indecision around $2.87 amid early Tuesday.
In doing so, the energy instrument justifies the overbought RSI (14), as well as the impending bear cross on the MACD indicator, while teasing the short-term sellers of the Natural Gas.
However, the XNG/USD remains within a 13-day-old bullish trend channel, as well as prints a successful upside break of the previous resistance line stretched from May 19. Additionally keeping the Natural Gas buyers hopeful is the commodity’s sustained trading beyond the 200-SMA.
Hence, the quote’s latest inaction around $2.87 may tease the intraday sellers amid downbeat oscillators, namely the RSI and MACD, but the Natural Gas price remains on the buyer’s radar unless the quote drops below the 200-SMA support of $2.49.
That said, the short-term sellers may take entry on a clear downside break of the previous day’s low surrounding $2.82.
Following that, the resistance-turned-support line of near $2.75 can challenge the XNG/USD bears before directing them to the convergence of the aforementioned bullish channel’s bottom line and the 50-SMA, around $2.70 at the latest.
Meanwhile, the latest peak of $2.93 and the $3.00 round figure can lure immediate Natural Gas buyers. However, the previously stated rising channel’s top line near $3.02 can challenge the XNG/USD bulls afterward.
Natural Gas Price: Four-hour chart
Trend: Pullback expected