Silver Price Analysis: XAG/USD snaps two-day uptrend below $25.00, focus on 200-SMA and US GDP
- Silver Price retreats from fortnight-old resistance to print the first daily loss in three.
- RSI pullback from overbought territory, looming bear cross on MACD tease XAG/USD sellers.
- 200-SMA, three-week-old rising support line challenges Silver bears before putting them in the driver’s seat.
- US GDP, Durable Goods Orders need to back recently hawkish Fed concerns to defend XAG/USD sellers.
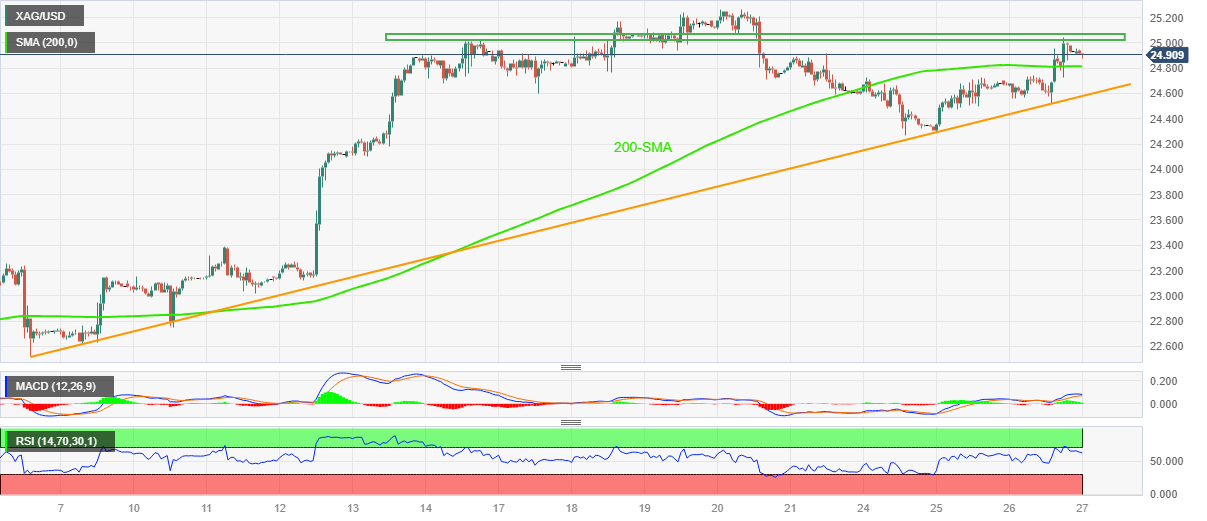
Silver Price (XAG/USD) sticks to mild losses around $24.90 amid early Thursday morning in Asia, after rising in the last two consecutive days to refresh the weekly top.
That said, the XAG/USD’s latest pullback could be linked to the metal’s inability to cross a two-week-old horizontal resistance area around $25.00-05 by the press time.
Also luring the Silver sellers is the looming bear cross on the MACD and the RSI (14) line’s retreat from the overbought territory.
However, the 200-SMA level of around $24.80 restricts further downside of the XAG/USD, a break of which will highlight an upward-sloping support line from early July, close to $24.55 at the latest, for the Silver sellers to watch.
In a case where the Silver Price remains bearish past $24.55, the weekly bottom of around $24.25 will act as the final defense of the Silver buyers.
Meanwhile, a clear upside break of the aforementioned horizontal resistance area surrounding $25.00-05 will need validation from the monthly peak close to $25.30 to welcome the XAG/USD bulls.
Following that, a run-up to challenge the yearly top of around $26.15 will be in the spotlight.
Silver Price: Hourly chart
Trend: Further downside expected