Gold Price Forecast: XAU/USD sellers eye $1,865 and central bankers – Confluence Detector
- Gold Price remains bearish at five-month low, lacks momentum of late.
- Sustained trading below $1,900 upside hurdle, China woes underpin bearish bias about XAU/USD.
- August PMIs, US Durable Goods Orders and Jackson Hole Symposium will be in the spotlight for clear directions.
- Central bankers’ hesitance to welcome policy pivot can drag Gold Price further towards the south.
Gold Price (XAU/USD) remains on the back foot at the lowest level in five months as market players seek solace in the US Dollar amid uncertainty ahead of this week’s top-tier data/events. Also exerting downside pressure on the XAU/USD could be the pessimism surrounding one of the world’s biggest commodity users, namely China.
Although China announced a slew of measures to restore investor confidence, the Gold Price fails to pick up bids as concerns about the dragon nation’s economic health remain dicey. Also, looming geopolitical woes and trade war fears join the People’s Bank of China’s (PBoC) no change in five-year Loan Prime Rates (LPRs), despite cutting the one-year LPRs by 10 basis points (bps), exert downside pressure on the Gold Price. Furthermore, upbeat US Treasury bond yields and cautious mood keeps the XAU/USD sellers hopeful.
However, the indecision about the Fed Chair Jerome Powell’s monetary policy bias and the market’s wait for this week’s August month Purchasing Managers Indexes (PMIs), US Durable Goods Orders and the top-tier central bankers’ speeches at the annual Jackson Hole Symposium event puts a floor under the Gold Price.
Also read: Gold Price Forecast: XAU/USD eyes a firm rebound to 200 DMA again
Gold Price: Key levels to watch
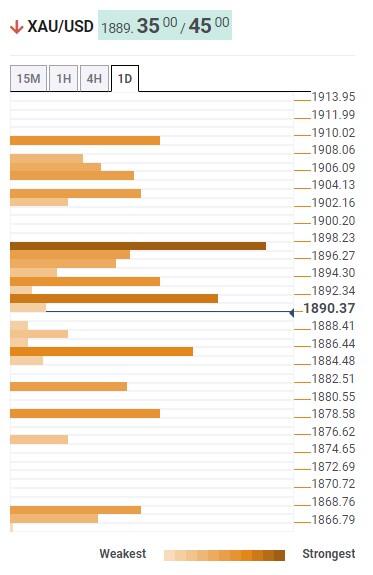
As per our Technical Confluence indicator, the Gold Price stays well beneath the $1,898 resistance confluence comprising Fibonacci 38.2% in one week, 100-SMA on one-hour and the previous daily high.
Adding strength to the downside bias is the XAU/USD’s sustained trading below $1,892 immediate hurdle including the Fibonacci 61.8% on one-day and the middle band of the Bollinger on the hourly play.
It’s worth noting that the convergence of the 10-DMA and Pivot Point one-week R1, close to $1,910, acts as the final defense of the Gold bears, a break of which could convince the buyers to return to the table.
Alternatively, the previous weekly low and Pivot Point one-day S1 puts a floor under the Gold Price near $1,885.
Following that, the $1,878 becomes a crucial support as it comprises the lower band of the Bollinger on the daily chart, as well as the Pivot Point one-week S1.
In a case where the Gold Price remains bearish past $1,878, the $1,865 support confluence, encompassing Pivot Point one-month S2, will be in the spotlight.
Here is how it looks on the tool
About Technical Confluences Detector
The TCD (Technical Confluences Detector) is a tool to locate and point out those price levels where there is a congestion of indicators, moving averages, Fibonacci levels, Pivot Points, etc. If you are a short-term trader, you will find entry points for counter-trend strategies and hunt a few points at a time. If you are a medium-to-long-term trader, this tool will allow you to know in advance the price levels where a medium-to-long-term trend may stop and rest, where to unwind positions, or where to increase your position size.