AUD/USD eases back into the midrange after Wednesday’s early climb above 0.6700
- AUD/USD slumped back toward Wednesday’s opening bids after a CPI-fueled run.
- The Aussie couldn’t hold onto territory above 0.6710.
- US CPI inflation expectations are weighing down risk appetite for the midweek.
The AUD/USD initially rose on Wednesday after Australian Consumer Price Index (CPI) inflation figures showed inflation cooling faster than market forecasts predicted. The pair climbed over the 0.6700 handle to hit an intraday high of 0.6713, but the pair is waffling back into the low side of 0.6700 as markets gear up for Thursday’s US CPI inflation print.
Australia’s November CPI comes in at 4.3% YoY vs. 4.4% expected
Australian CPI inflation for the year ended November slipped to 4.3% versus the median market forecast of 4.4% and fell even further from October’s YoY print of 4.9%. With inflation pressures easing, Aussie bulls found a reason to bid, but buying pressure proved short-lived as markets turn broad-face to look towards Thursday’s US CPI inflation print.
US CPI Preview: Forecasts from 10 major banks
Market participants are hoping for signs that the Federal Reserve (Fed) will get pushed into the next rate-cutting cycle sooner rather than later, and major investors are looking for easing inflation to be the spark the Fed needs to begin slashing its main reference rate. Despite broad-market hopes, market forecasts see the headline US CPI inflation print for December to come in at 0.2% MoM compared to November’s print of 0.1%.
Annualized US CPI inflation through December is likewise expected to tick slightly higher from 3.1% to 3.2%, while Core MoM CPI is expected to hold steady at 0.3%.
With investors hoping for signs of easing long-term inflation to kickstart the next rate cut cycle, markets will be focusing on annualized Core CPI through December, which is forecast to slightly decline from 4.0% to 3.8%.
AUD/USD Technical Outlook
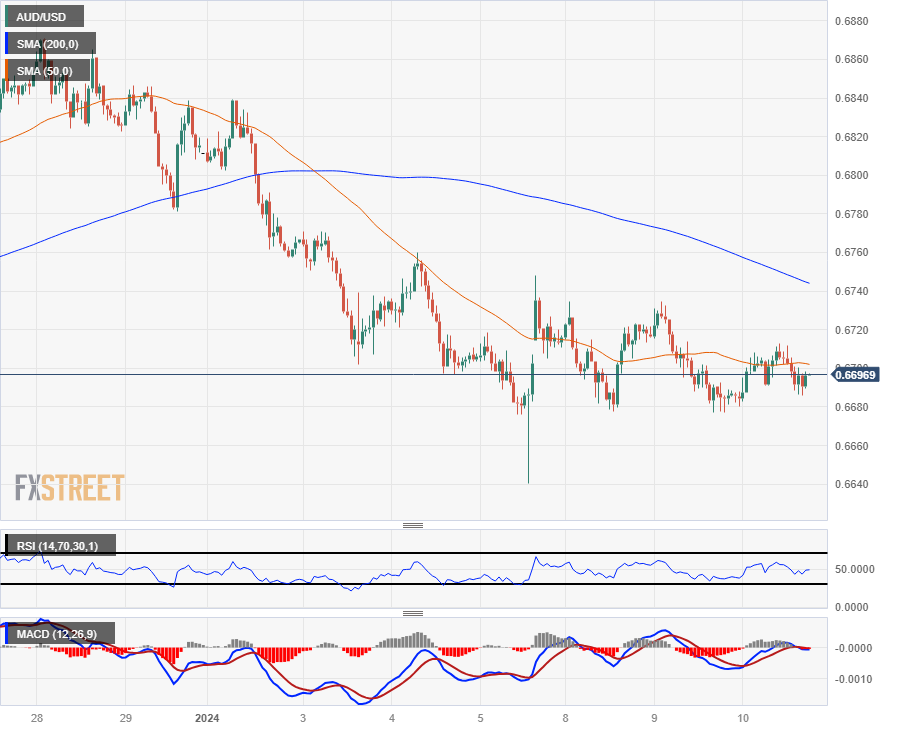
The AUD/USD is cycling the 50-hour Simple Moving Average (SMA), hitting the price median for a fifth consecutive day as momentum drains out of the pair. The AUD/USD sees descending resistance from a declining 200-hour SMA falling into 0.6740.
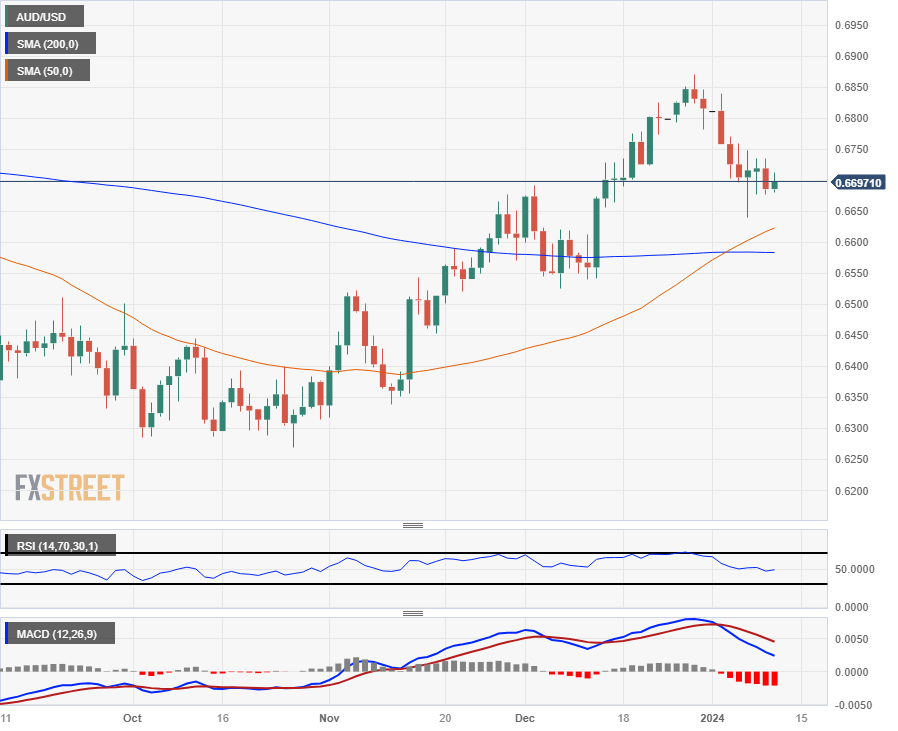
The AUD/USD has fallen around 2.5% from late December’s swing high into 0.68711, but near-term technical support is priced in from a 50-day and 200-day SMA crossover near the 0.6600 handle.
AUD/USD Hourly Chart
AUD/USD Daily Chart
AUD/USD Technical Levels