Back
22 Oct 2018
EUR/USD Technical Analysis: Strong resistance emerges at 1.1570/80
- The pair is looking to extend the rebound from last week’s lows in the 1.1430 region to levels above 1.1500 the figure.
- Immediate hurdle aligns in the 1.1570/80 band, where converges the 21- and 55-day SMA.
- Further upside should see the next resistance at recent tops in the 1.1620 region, which is reinforced by the 100-day SMA.
EUR/USD daily chart
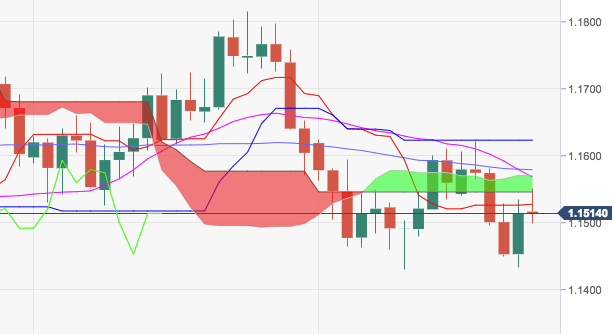
EUR/USD
Overview:
Last Price: 1.1518
Daily change: -13 pips
Daily change: -0.113%
Daily Open: 1.1531
Trends:
Daily SMA20: 1.1571
Daily SMA50: 1.1584
Daily SMA100: 1.1623
Daily SMA200: 1.1909
Levels:
Daily High: 1.154
Daily Low: 1.1531
Weekly High: 1.1622
Weekly Low: 1.1433
Monthly High: 1.1816
Monthly Low: 1.1526
Daily Fibonacci 38.2%: 1.1496
Daily Fibonacci 61.8%: 1.1472
Daily Pivot Point S1: 1.1453
Daily Pivot Point S2: 1.1392
Daily Pivot Point S3: 1.1351
Daily Pivot Point R1: 1.1555
Daily Pivot Point R2: 1.1596
Daily Pivot Point R3: 1.1657