EUR/GBP Technical Analysis: Euro weakens against GBP as bears drive the market to 0.8900 figure
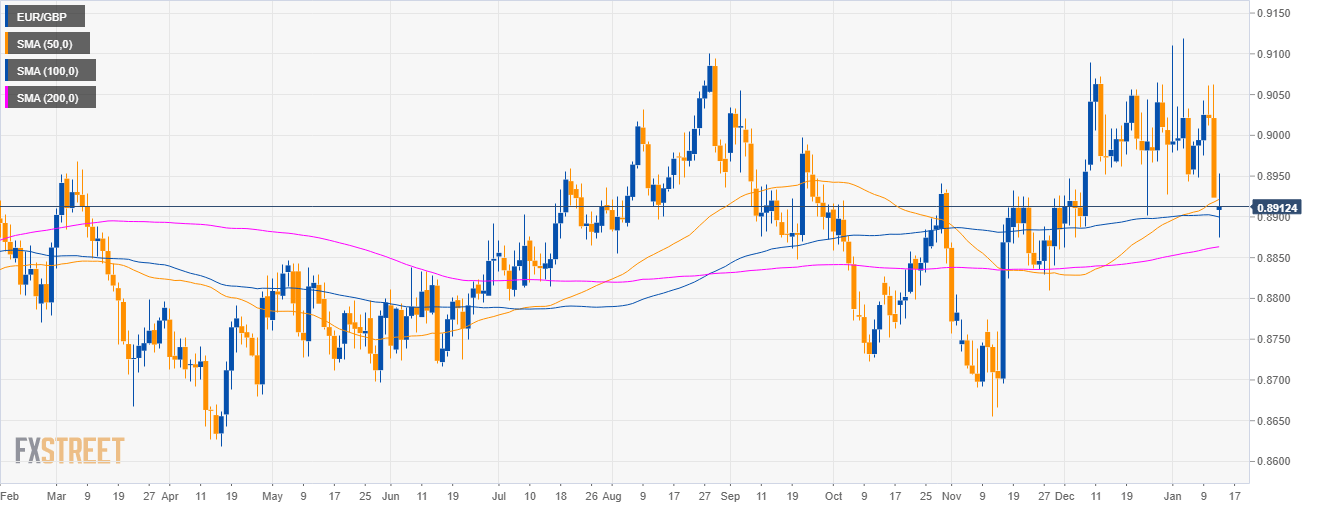
EUR/GBP daily chart
- EUR/GBP is trading in a sideways trend above the 200-period simple moving average (SMA).
- As forecast EUR/GBP broke down to the 0.8900 figure.
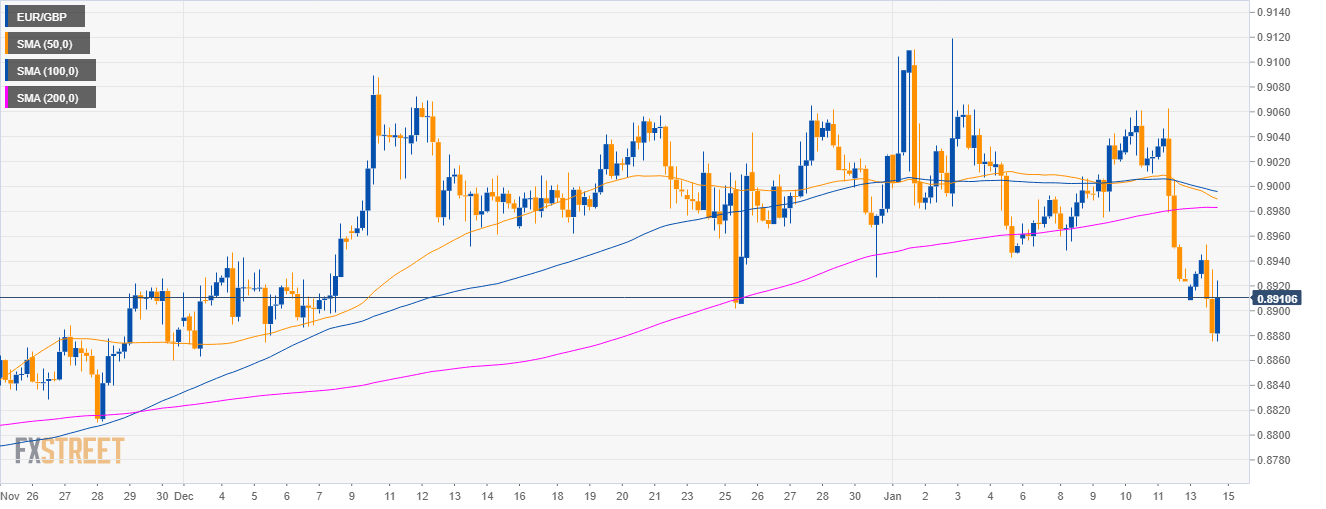
EUR/GBP 4-hour chart
- EUR/GBP is trading at 2-month’s low.
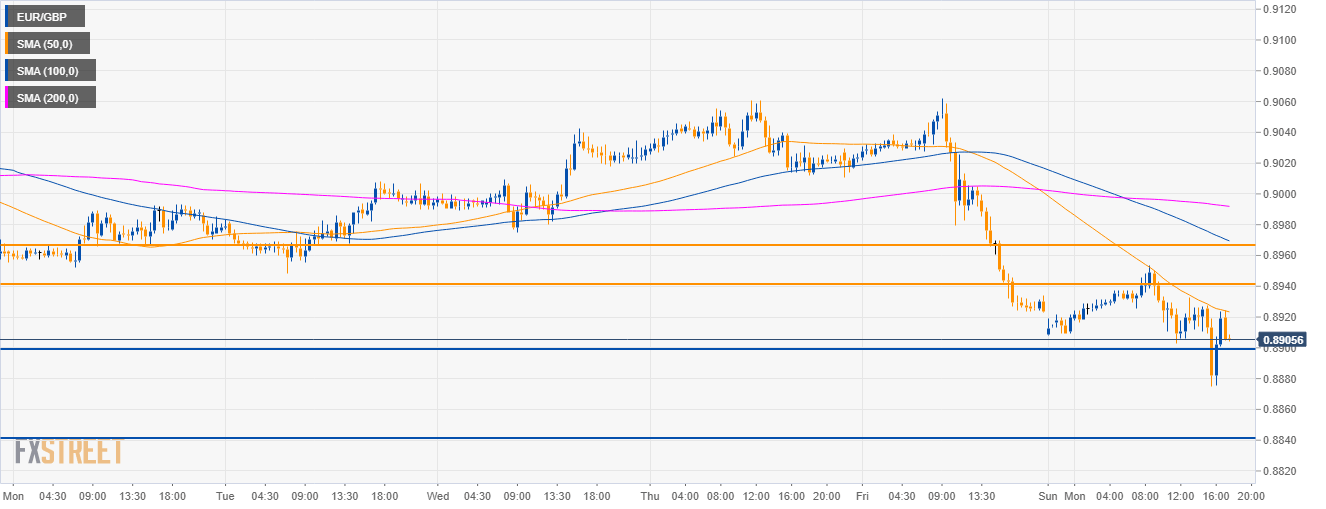
EUR/GBP 30-minute chart
- EUR/GBP is trading below its main SMAs.
- The momentum is bearish therefore a retest of 0.8900 and further weakness to 0.8840 can be on the cards.
Additional key levels
EUR/GBP
Overview:
Today Last Price: 0.8913
Today Daily change: -11 pips
Today Daily change %: -0.123%
Today Daily Open: 0.8924
Trends:
Previous Daily SMA20: 0.8998
Previous Daily SMA50: 0.8918
Previous Daily SMA100: 0.8901
Previous Daily SMA200: 0.8862
Levels:
Previous Daily High: 0.9062
Previous Daily Low: 0.8923
Previous Weekly High: 0.9062
Previous Weekly Low: 0.8923
Previous Monthly High: 0.9089
Previous Monthly Low: 0.8863
Previous Daily Fibonacci 38.2%: 0.8976
Previous Daily Fibonacci 61.8%: 0.9009
Previous Daily Pivot Point S1: 0.8877
Previous Daily Pivot Point S2: 0.8831
Previous Daily Pivot Point S3: 0.8738
Previous Daily Pivot Point R1: 0.9016
Previous Daily Pivot Point R2: 0.9109
Previous Daily Pivot Point R3: 0.9155