Back
13 Feb 2019
USD/INR Technical Analysis: Bears may get better levels
USD/INR fell 0.84 percent yesterday, the biggest single-day drop since Dec. 20, bolstering the already bearish technical setup, as represented by the bearish marubozu reversal and the downward sloping 5- and 10-day moving averages (MAs).
So, the 200-day MA lined up at 70.41 could be put to test soon, albeit after a minor bounce to 70.65-70.70, as the relative strength indices (RSIs) on the hourly and 4-hour charts are reporting oversold conditions.
Daily chart
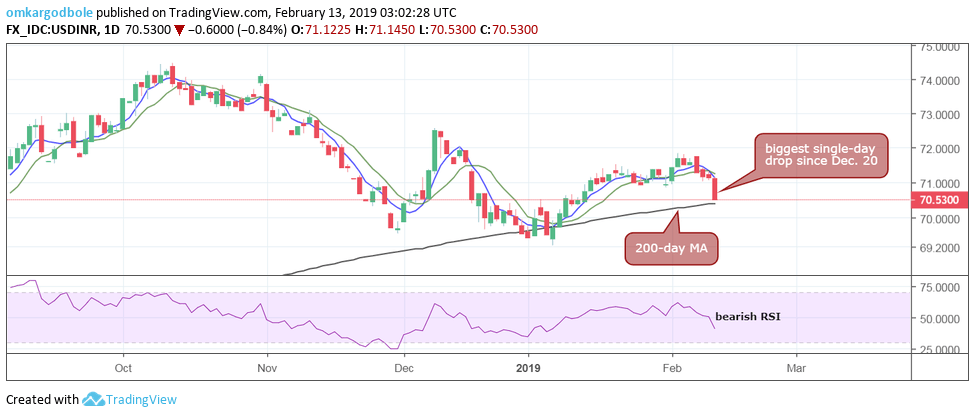
Trend: bearish