Back

Oil Technical Analysis: WTI blasting up towards $63.00 a barrel

Oil daily chart

  • WTI is trading in a bull trend above its main simple moving averages (SMAs).


Oil 4-hour chart

  • Oil is having a strong reversal from $60.00 a barrel as the market is nearing the 200 SMA now at the 62.63 level. 


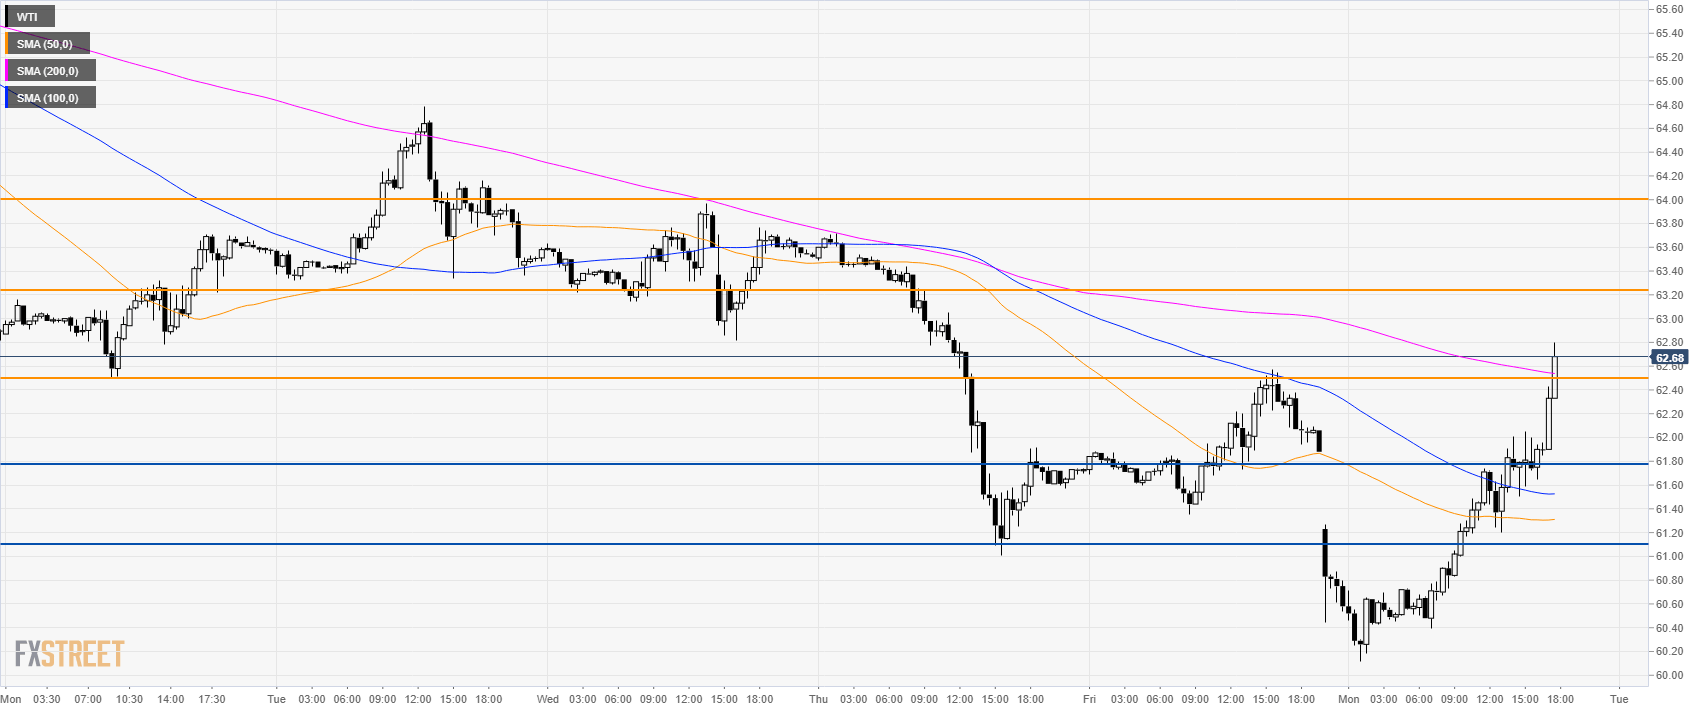
Oil 30-minute chart

  • WTI is pushing beyond 62.50 resistance and the 200 SMA. 
  • Bulls can continue the move up towards 63.20 and 64.00 resistances.
  • Support is seen at 62.50 and 61.80 level.
Additional key levels


USD/CAD meets strong resistance area and bulls capitulate on cautious trade-talk optimism

Compared to Asia's session, there is a better risk tone as investors have had time to read into the nuts and bolts of trade war noise that kicked off
Leer más Previous

?Update to trade wars: China still plans to move forward with talks - South China Morning Post

South China Morning Post is reporting that China still plans to move forward with talks: China is still preparing to send a delegation to Washington f
Leer más Next