Back

29 Jul 2019
EUR/USD technical analysis: Fiber challenging 1.1134 resistance near daily highs
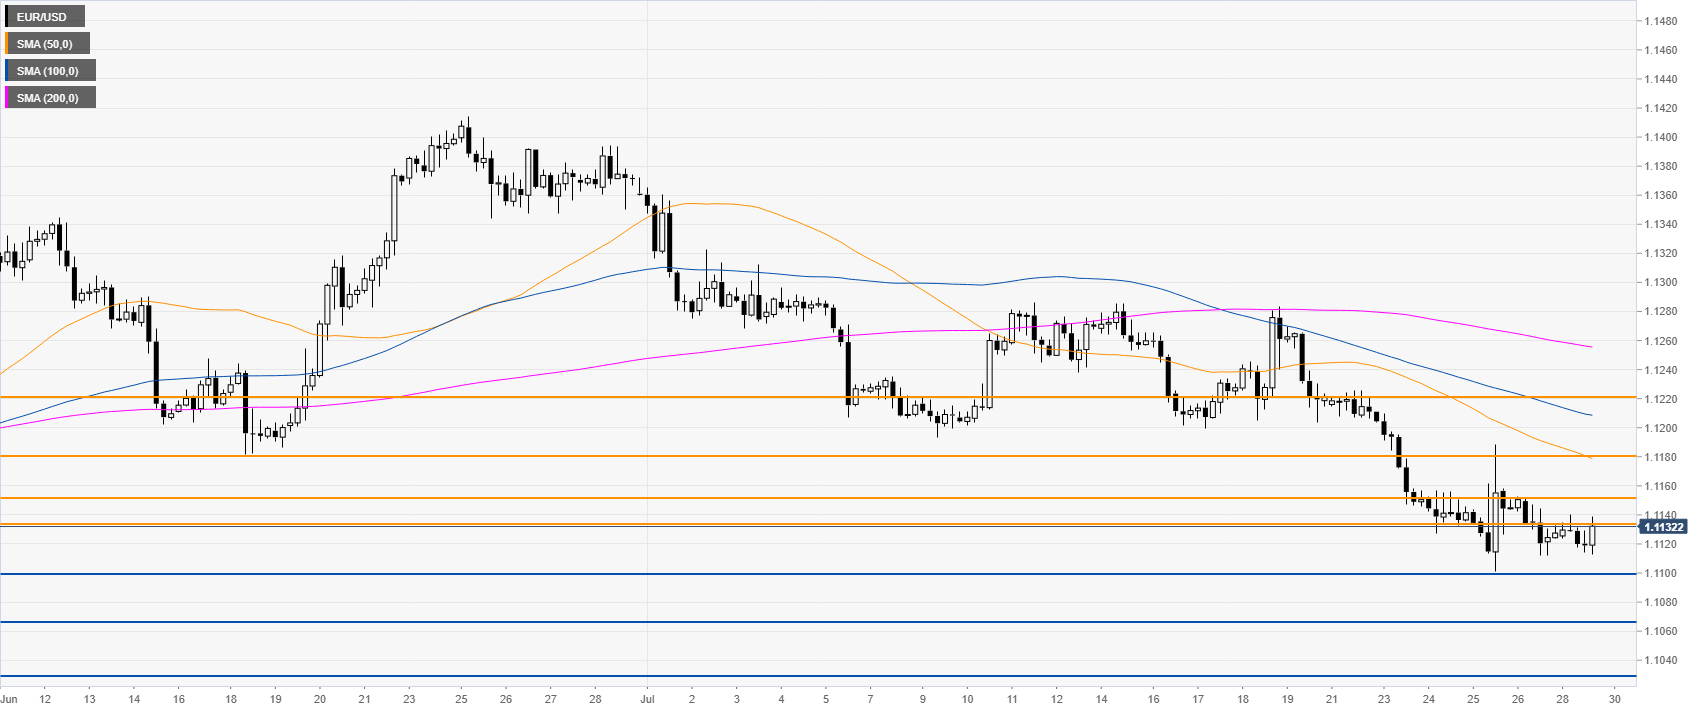
- EUR/USD is consolidating last week losses as the market is challenging 1.1134 resistance.
- The yearly low at 1.1101 is the key level to beat for sellers.
EUR/USD daily chart
EUR/USD is in a bear trend trading below its main daily simple moving averages (DSMAs).
EUR/USD 4-hour chart
EUR/USD is testing the 1.1134 resistance and its main SMAs, suggesting bearish momentum in the medium term. A break below 1.1101 (2019 low) is crucial for bears. If broken then 1.1064, 1.1029 and 1.1006 can become next, according to the Technical Confluences Indicator.
EUR/USD 30-minute chart
Fiber starts the week by trading in a small range. Immediate resistances are seen at the 1.1134, 1.1151, 1.1180 and the 1.1200 level, according to the Technical Confluences Indicator.

Additional key levels