Back
9 Aug 2019
AUD/USD technical analysis: Aussie challenging the daily lows, sub-0.6800 figure
- The Aussie is correcting down below the 0.6800 figure.
- The level to beat for bears are seen at the 0.6785 and 0.6761 support levels.
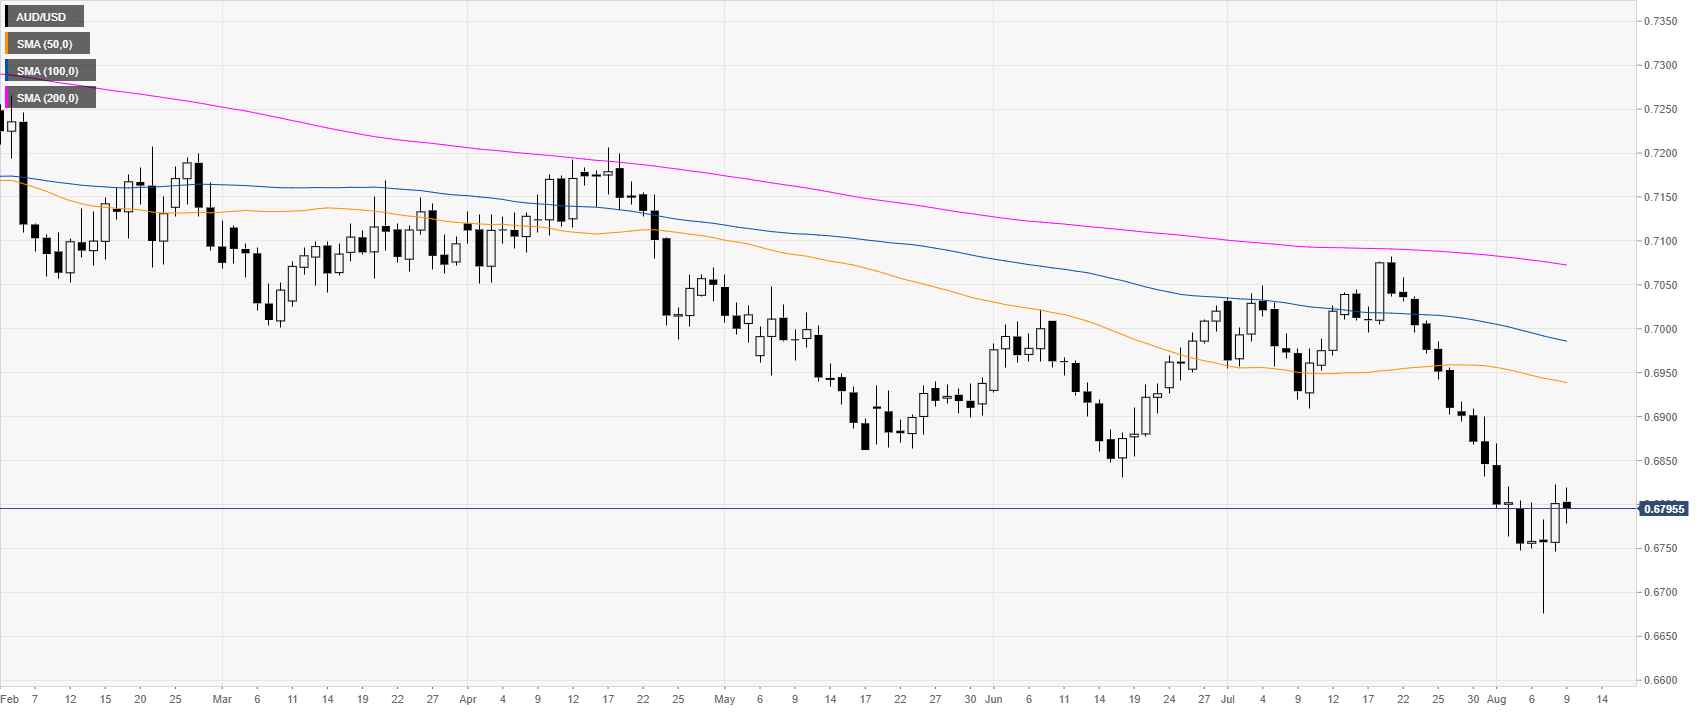
AUD/USD daily chart
In the last two days, the Aussie has been recovering some ground after hitting a new multi-month low at the 0.6676 level.
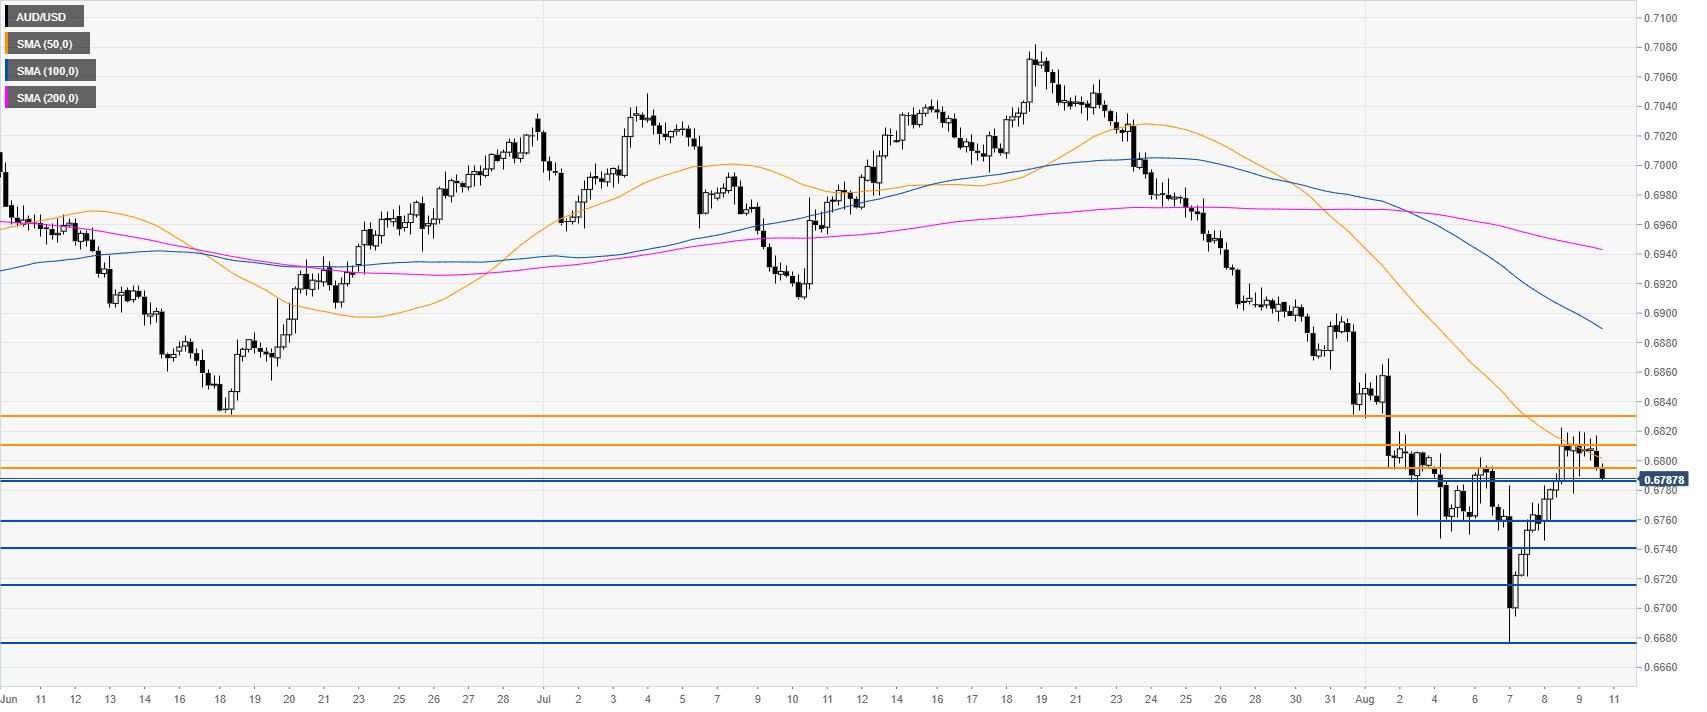
AUD/USD 4-hour chart
The Aussie is trading in a bear trend below the main simple moving averages (SMAs). The market is challenging the 0.6785 support. A break below that level would see the Aussie trade lower towards 0.6761, 0.6740 and 0.6715 in the medium term, according to the Technical Confluences Indicator.
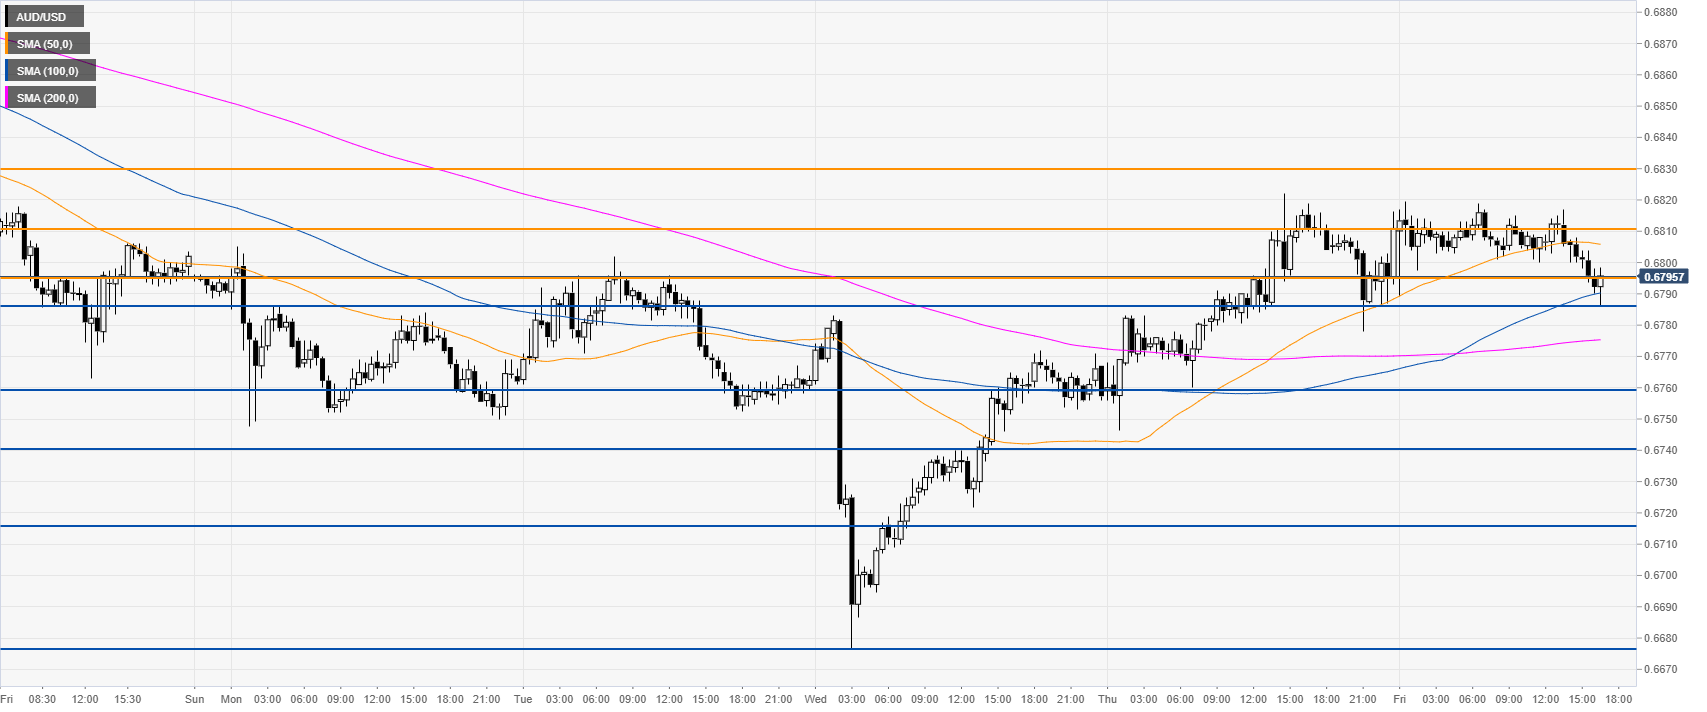
AUD/USD 30-minute chart
The market is pulling back down as the market is trading between the 100 and 200 SMAs. The market is expected to decline further; however, immediate resistance can be seen at 0.6796, 0.6810 and the 0.6830 levels, according to the Technical Confluences Indicator.
Additional key levels