GBP/JPY technical analysis: 128.10/25 limits immediate upside below 200-HMA
- GBP/JPY remains on the back below the key resistances, near the multi-month low, amid no-deal Brexit risk.
- Technical indicators signal pullback while resistance-confluence will limit the recovery.
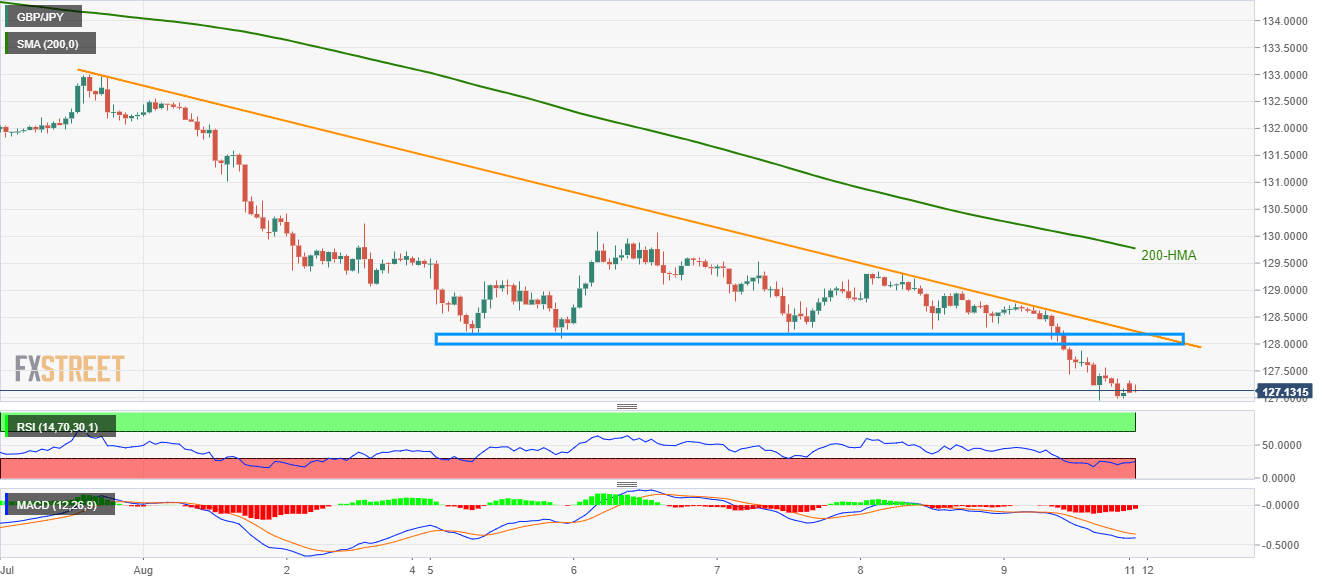
Despite GBP/JPY sellers catching a breath around September 2017 low, the pair remains beneath short-term key resistance-area, not to forget under the 200-HMA, as it trades near 127.14 during the early Asian session on Monday.
The British Pound (GBP) has recently been bearing the burden of the increase in odds favoring no-deal Brexit.
The region between 128.10 and 128.25 consists of multiple lows marked during last-week and a downward sloping trend-line stretched since July-end top.
Adding to the upside barrier is 200-hour moving average (HMA) near 129.77, a break of which can escalate the pair’s run-up towards 130.000 and then to July 30 low near 131.61.
On the downside, recent low surrounding 126.96 becomes the key support that holds the gate for the quote’s further south-run towards September 2017 low near 125.62.
It should also be noted that important technical indicators like 14-bar relative strength index (RSI) and 12-bar moving average convergence and divergence (MACD) signal sellers’ exhaustion.
GBP/JPY hourly chart
Trend: Bearish