Back
9 Sep 2019
US Dollar Index Technical Analysis: Rebounds from the support line at 98.00
- The index has managed to regain attention and retake the 98.40 area after bottoming out in the 98.00 neighbourhood last Friday.
- While above the support line, today at 98.02, the near term bullish bias should remain in place, leaving the door open for a potential visit to YTD highs near 99.40 (September 3).
- If the selling bias resumes, initial contention emerges in the 98.00 area ahead of the Fibo retracement at 97.87. Further south aligns the 55-day and 100-day SMAs at 97.62 and 97.55, respectively.
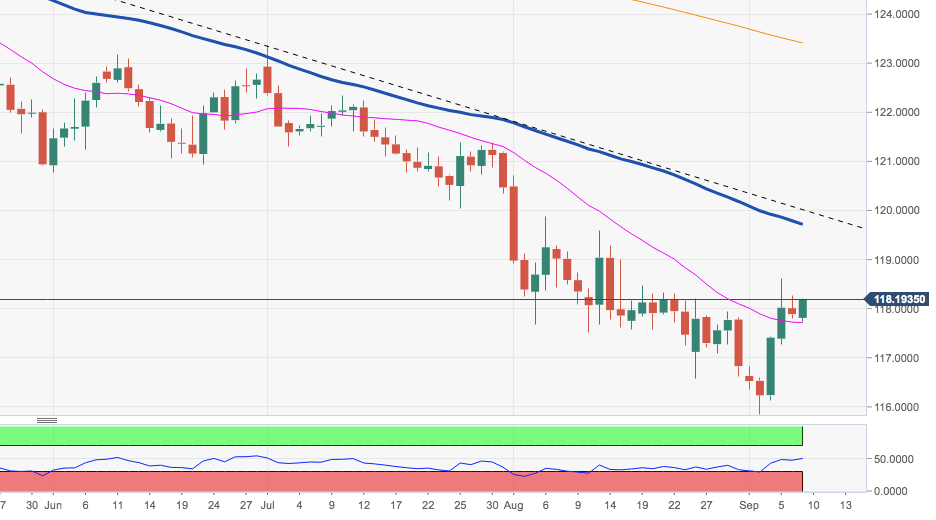
DXY daily chart

