GBP/JPY technical analysis: 200-day SMA in the spotlight
- GBP/JPY fails to hold strength beyond 61.8% Fibonacci retracement.
- A downside break of 200-day SMA can recall a 50% Fibonacci retracement level.
- The late-may high will be on the bull’s radar.
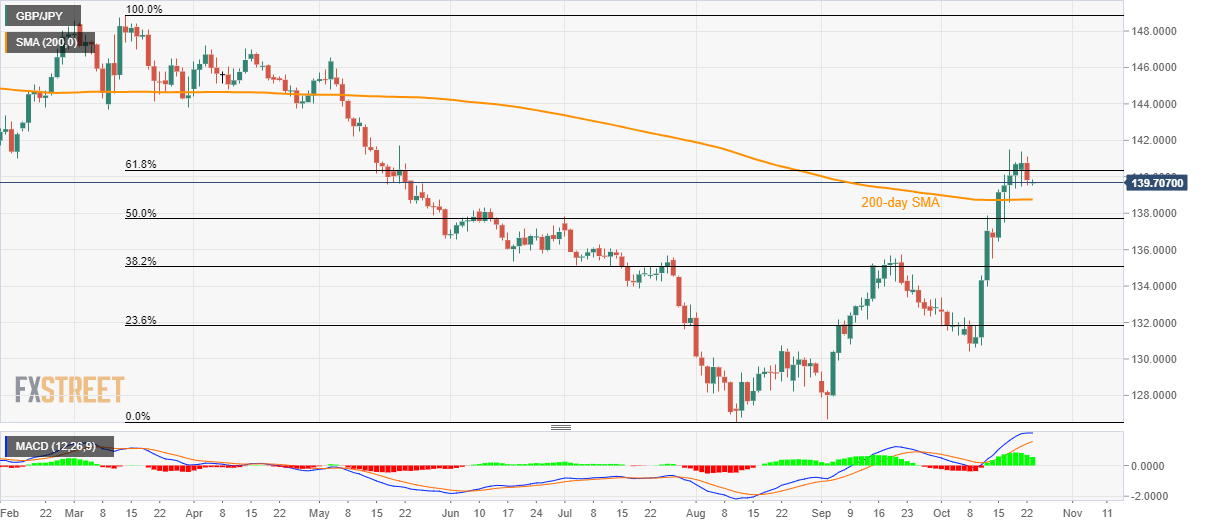
Having slipped back beneath 61.8% Fibonacci retracement of March-August downpour, GBP/JPY traders await a downside break of 200-day SMA for confirmation of the latest weakness. The quote seesaws near 139.70 by the press time of Wednesday’s Asian session.
Should prices decline below 200-day Simple Moving Average (SMA) level of 138.74, 50% Fibonacci retracement level of 137.70 will become the sellers’ target.
However, early-July high and September month top, close to 136.30 and 135.65 respectively, will lure bears during pair’s further declines below 137.70.
Meanwhile, buyers will look for a successful break above the late-May high of 141.75 to target April month lows near 143.75.
It’s worth noting that 140.00 round-figure can act as an immediate upside barrier.
GBP/JPY daily chart
Trend: pullback expected