NZD/USD technical analysis: 100-day SMA, 50% Fibo. restrict immediate upside
- NZD/USD stays above the nearly three-week-old rising trend line.
- A sustained break of 50% Fibonacci retracement will recall August high.
- Multiple supports surrounding 23.6% Fibonacci retracement, 0.6330.
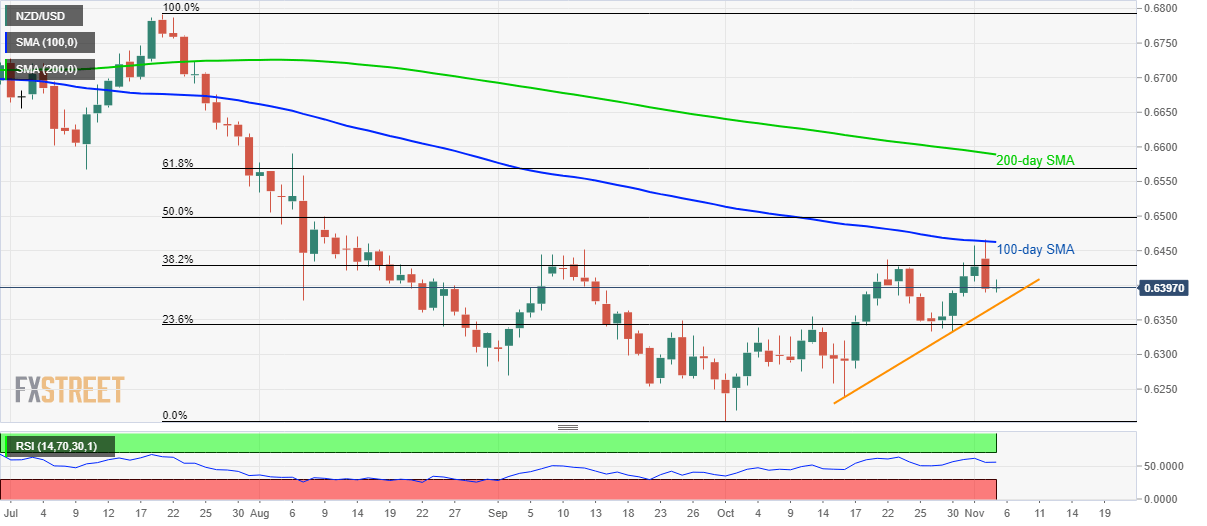
The NZD/USD pair’s pullback from 100-day Simple Moving Average (SMA) isn’t speaking loudly for sellers as prices remain above the near-term key support line while taking rounds to 0.6400 during early Tuesday.
With this, the 100-day SMA level of 0.6463 holds a high place on buyers’ radar. However, 38.2% Fibonacci retracement level of July-October declines, at 0.6430, may offer immediate resistance to the pair’s upside.
In a case where buyers dominate beyond 100-day SMA, 50% Fibonacci retracement level of 0.6500 and August month high of 0.6590 will be in the spotlight.
Alternatively, pair’s daily closing below 0.6370 trend line support highlights multiple rest-points around 23.6% Fibonacci retracement level of 0.6343 and 0.6330.
It’s worth mentioning that the pair’s declines below 0.6330 could recall 0.6250 and 0.6200 to the chart.
NZD/USD daily chart
Trend: sideways