AUD/JPY Price Analysis: Declines further below 200-HMA
- AUD/JPY snaps the two-day winning streak.
- Bearish MACD, declining RSI from overbought area favor sellers.
- 200-HMA, 61.8% Fibonacci retracement restrict near-term upside.
While extending its U-turn from the 200-HMA, portrayed last-week, the AUD/JPY pair drops 1.3% to 63.50 amid the initial Asian session on Monday.
In addition to the failure to cross the key HMA, coupled with 61.8% Fibonacci retracement of its March 10-19 fall, bearish MACD and declining RSI also favor the sellers.
That said, the pair currently declines towards 62.85/80 horizontal support ahead of taking rest on the 23.6% Fibonacci retracement level of 62.00.
In a case where AUD/JPY prices continue dropping past-62.00, 61.40 may offer an intermediate halt to the monthly bottom surrounding 59.90.
Alternatively, buyers will refrain from entry unless the pair crosses 65.40/55 area comprising 200-Hour Moving Average (HMA) and 61.8% Fibonacci retracement.
In doing so, 67.70/75 will be on their radar whereas 66.30 can offer an intermediate halt to the run-up.
AUD/JPY hourly chart
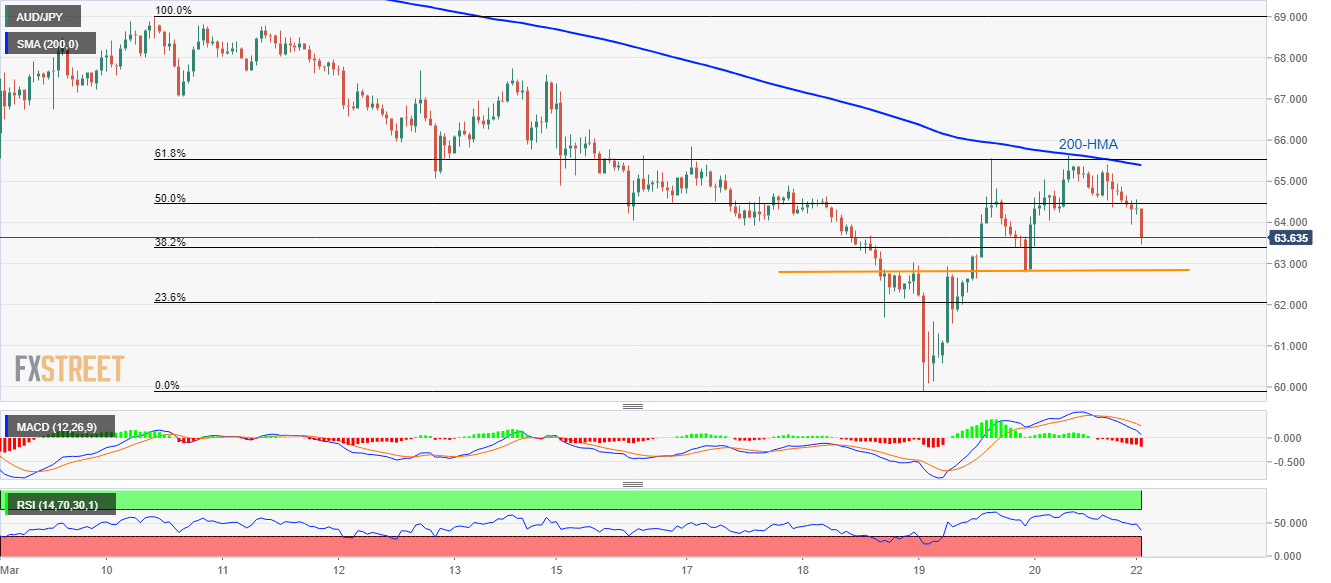
Trend: Bearish