Back
14 May 2020
US Dollar Index Asia Price Forecast: DXY hits 2.5-week highs, settles near 100.35 level
- US Dollar Index (DXY) popped to fresh May’s highs this Thursday.
- The level to beat for buyers is the 110.40 resistance.
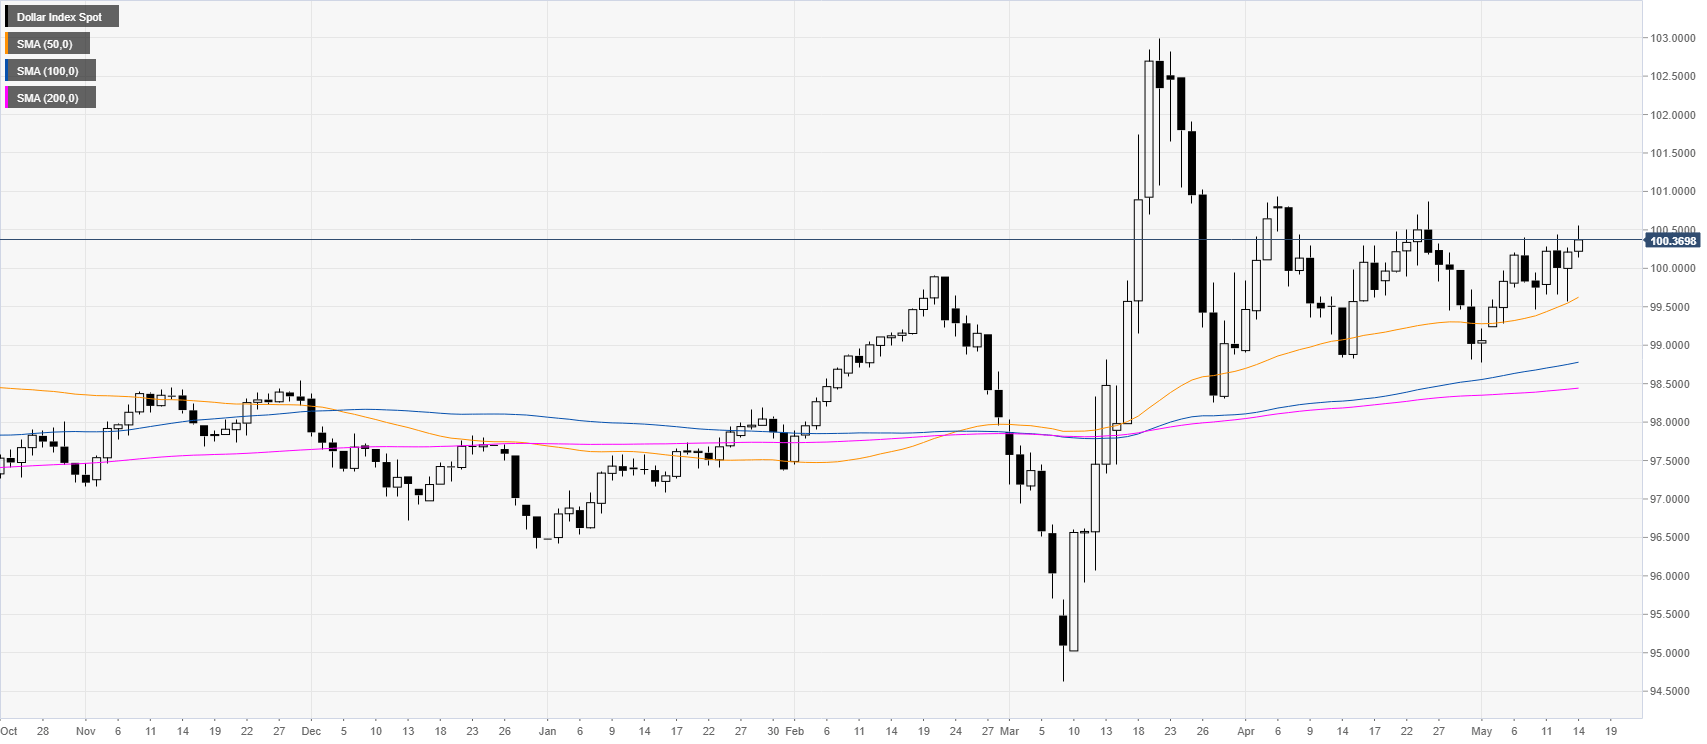
DXY daily chart
The US Dollar Index (DXY) index is grinding up above the 100.00 mark while trading above the main SMAs on the daily time-frame suggesting that the bull trend is intact.
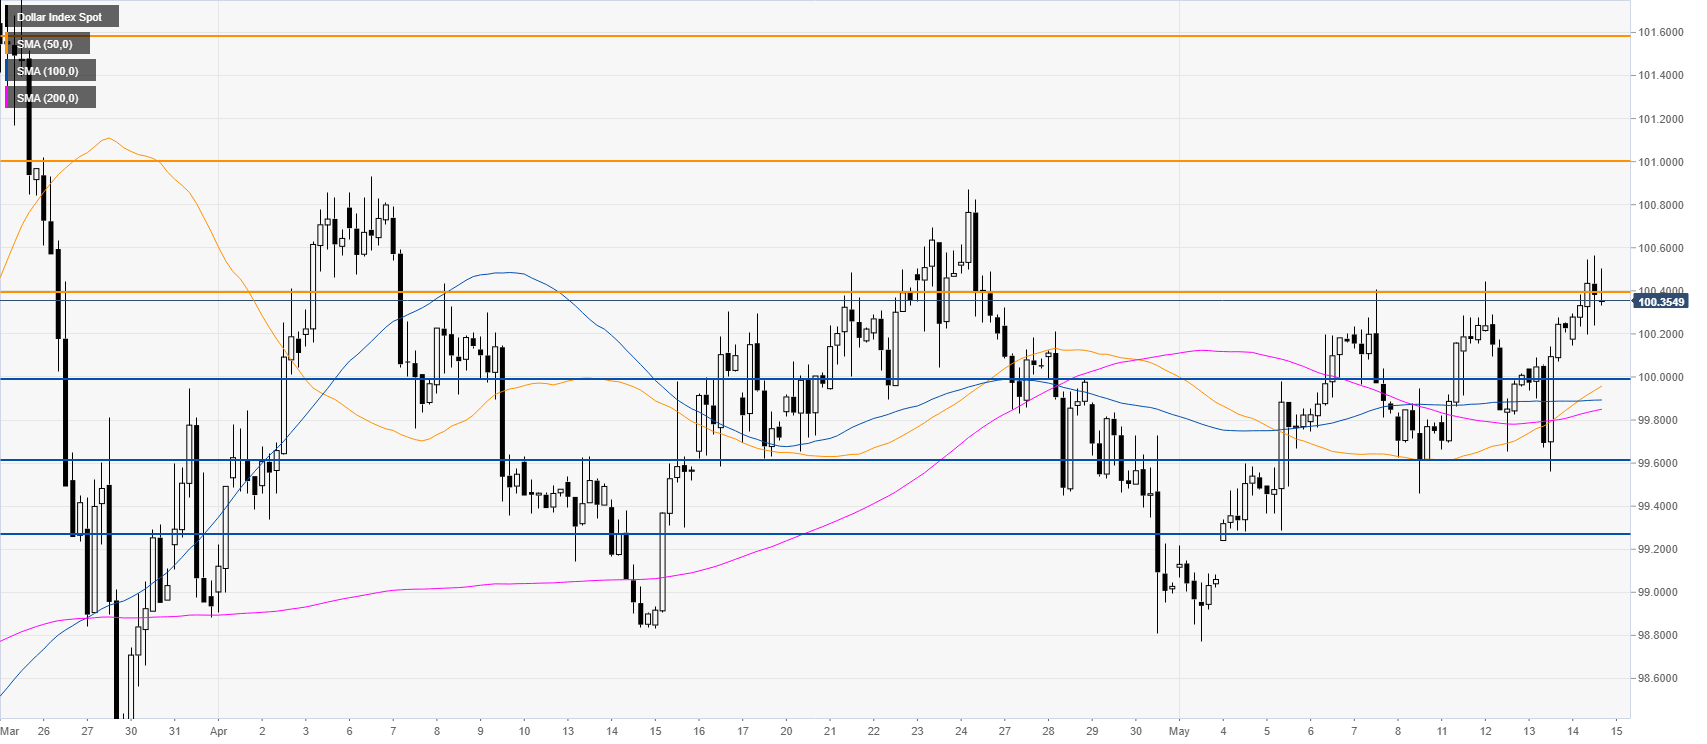
DXY four-hour chart
DXY is trading near the 110.40 resistance while above the main SMAs on the four-hour chart. The bulls remain in full control with the market making higher highs and lows in the two first weeks of May. Buyers are likely looking for a potential extension towards the 101.00 figure and above. Meanwhile, occasional retracements down could meet support near the 100.00 and 99.60 levels
Additional key levels