Back
18 May 2020
US Dollar Index Asia Price Forecast: DXY sees worst daily decline in 5-weeks
- US Dollar Index (DXY) had its worst daily decline since early April.
- DXY is testing an important support near 99.60 level.
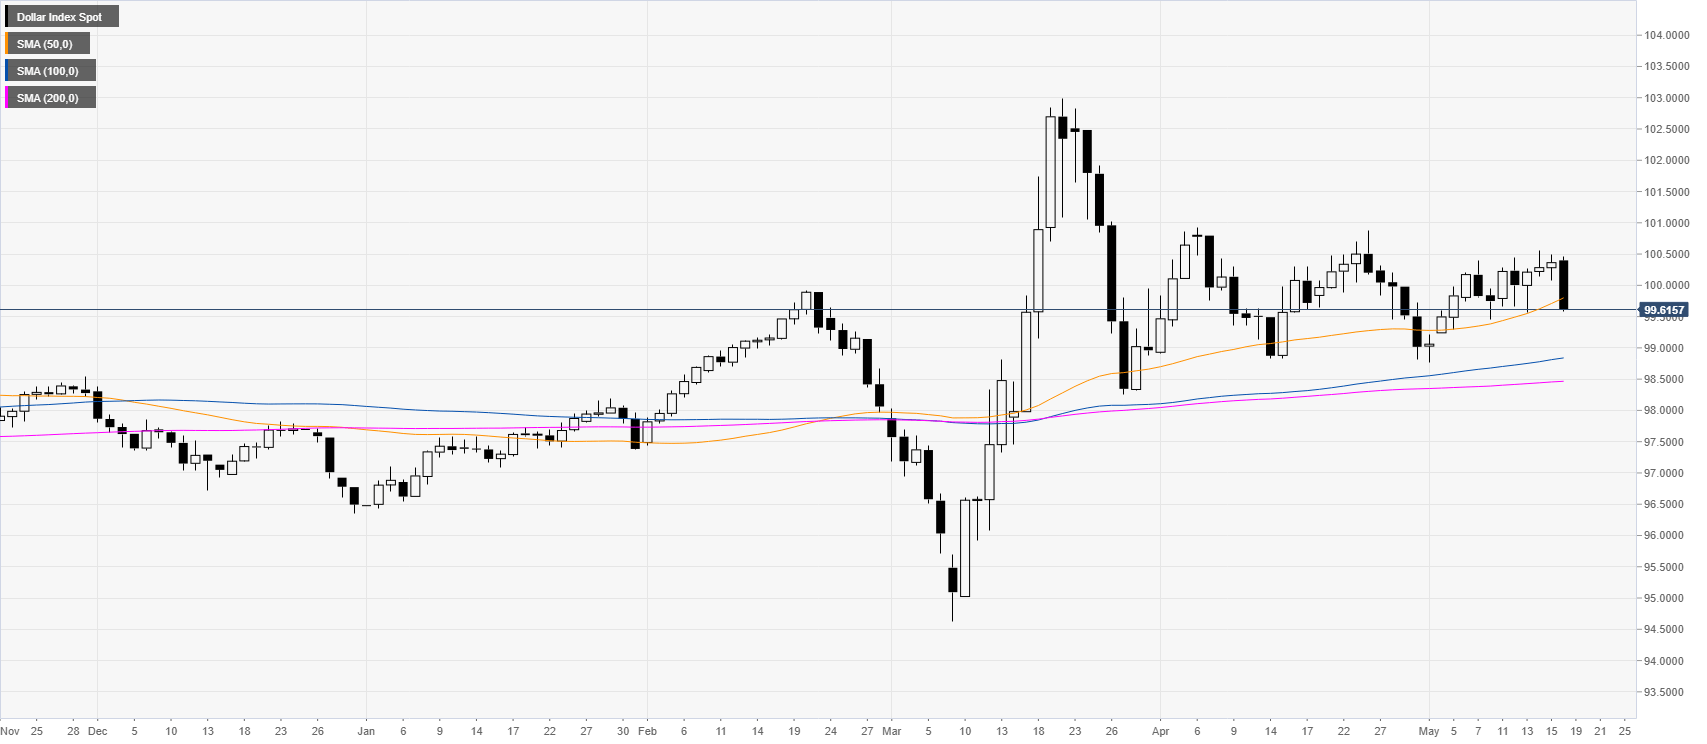
DXY daily chart
The US Dollar Index (DXY) turned lower this Monday challenging 3-day lows and the 50 SMA on the daily chart.
DXY four-hour chart
DXY started the trading week with a sharp drop below the 100.00 mark and the main SMAs. The market is challenging the 99.60 support level which was key in May. Bulls could try to lift the market and regain the 100.00 level. However, a clear break below the 99.60 level can lead to more down and decline towards the 99.30 and the 98.90 levels.

Additional key levels