GBP/JPY Price Analysis: 50-day SMA probes break of two-month old falling trendline
- GBP/JPY retreats from 12-day top of 133.04.
- Failure to provide a sustained break of 50-day SMA triggers the pullback.
- Sellers await downside break of short-term support line for fresh entries.
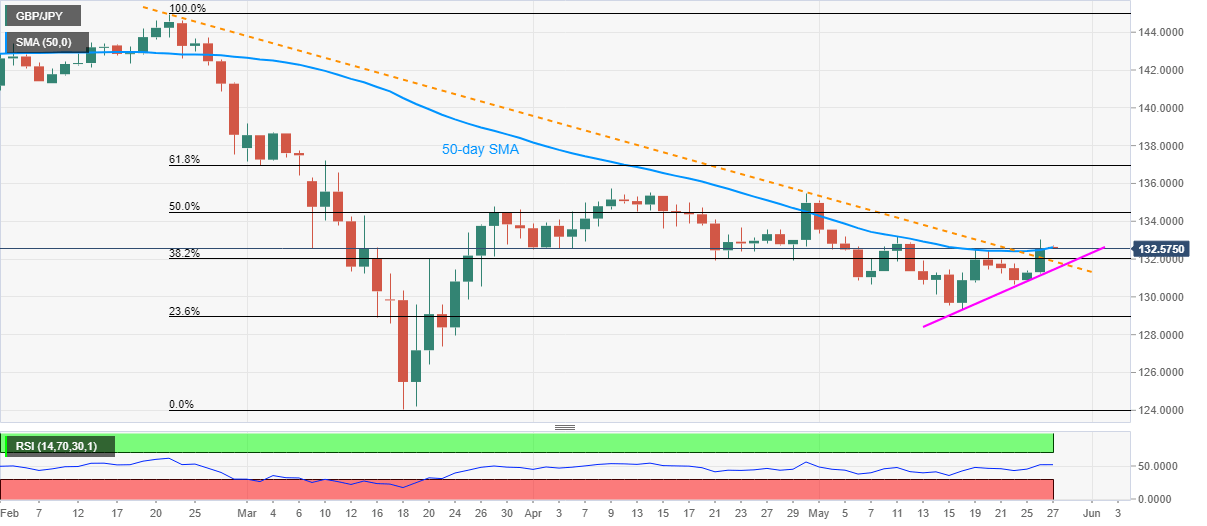
GBP/JPY steps back from the multi-day top while declining to 132.58 ahead of Wednesday’s Tokyo open. In doing so, the pair fails to justify its break of a falling trend line stretched from February 21. The reason could be traced from the pair’s inability to provide a successful break beyond 50-day SMA.
As a result, the pair’s pullback to the resistance-turned-support line of 131.85 becomes more likely. However, the bears will remain cautious unless the quote slips below the one-week-old support line, at 131.42 now.
In a case where the GBP/JPY prices manage to drop below 131.42 on a daily closing basis, it’s drop towards 130.00 gains more assents.
Meanwhile, the pair’s fresh upside beyond Tuesday’s top of 133.04 could aim for 50% Fibonacci retracement of February-March fall, around 136.95.
Additionally, the bulls’ successful dominance past-137.00 will be a threat to April 30 high of 135.45.
GBP/JPY daily chart
Trend: Pullback expected