Gold Price Analysis: Battle over $1,933 critical for the recovery – Confluence Detector
Gold is looking for a new direction after crashing by $200 before recovering by $100. Some of the recent moves were fueled by US bond auctions. These have been causing jitters in yields – sending XAU/USD down when returns rose and doing the opposite when the tide turned again.
Another reason for the decline is profit-taking – the precious metal entered overbought conditions on several charts. How is gold positioned now?
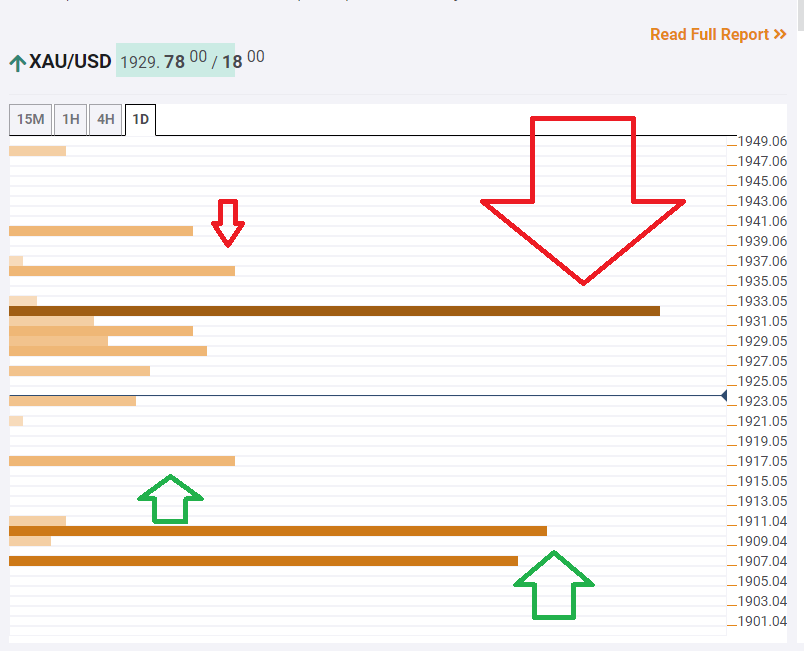
The Technical Confluences Indicator is showing that fierce resistance awaits at $1,933, which is a dense cluster including the Simple Moving Average 10-15m, the Fibonacci 23.6% one-month, the Bollinger Band 15min-Middle, and the SMA 10-1h.
The next target is close – $1,936, which is where the BB one-day Middle and the BB 15min-Upper hit the price.
Some support awaits at $1,917, which is where the Fibonacci 38.2% one-day hits the price.
A more considerable cushion is at $1.910, which is the confluence of the BB one-hour Lower and the PP one-week Support 2.
Overall, resistance is stronger than support.
Key XAU/USD resistances and supports
Confluence Detector
The Confluence Detector finds exciting opportunities using Technical Confluences. The TC is a tool to locate and point out those price levels where there is a congestion of indicators, moving averages, Fibonacci levels, Pivot Points, etc. Knowing where these congestion points are located is very useful for the trader, and can be used as a basis for different strategies.
Learn more about Technical Confluence