USD/INR Price News: Indian rupee sellers cheer short-term falling wedge confirmation above 74.00
- USD/INR refreshes intraday high while snapping a two-day winning streak.
- Confirmation of a bullish chart pattern joins upbeat RSI conditions to favor the bulls.
- 200-HMA adds strength to the downside support, monthly high on the buyers’ radar.
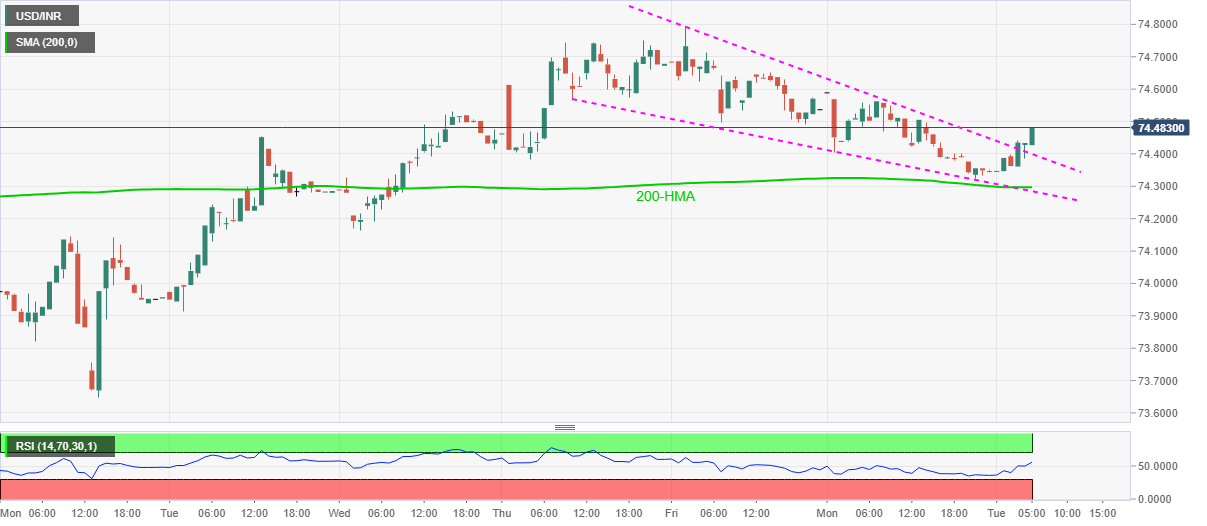
USD/INR rises to 74.47, up 0.18% intraday, during the initial hours of Indian trading on Tuesday. In doing so, the pair confirms a bullish chart formation, falling wedge, amid the recovering RSI that is yet to reach the overbought limit.
As a result, USD/INR bulls are currently directed towards Friday’s top near 74.80 while the monthly high around 75.00 could be on their radars afterward.
In a case where the quote rallies past-75.00, August top near 75.30 and the mid-July high close to 75.50 could return to the charts.
Alternatively, the pair’s pullback moves below the previous resistance line, at 74.40 now, need to slip beneath the 200-HMA level of 74.30, to recall the USD/INR sellers.
Following that, last Wednesday’s low near 74.15 and the 74.00 round-figure could entertain the bears ahead of directing them to the monthly low around 73.65.
USD/INR hourly chart
Trend: Further upside expected