S&P 500 (ES SPY) Technical Forecast: Buy the dip or get chopped up
- Buy the dip works again as markets rally.
- Is this another record rally or some choppy trading?
- Nasdaq now takes on the leadership role but market breadth diminishes.
Tuesday's price action confirmed the bounce witnessed on Monday as the Nasdaq decided to lead the way higher. About time you might say as this one has been lagging since April. Markets are becoming increasingly choppy as the summer progresses, no surprise given equity market valuations and summer volumes in play now that last Friday's quadruple witching is out of the way. For those not familiar with the term, quadruple witching is the simultaneous expiry of four (quadruple) derivative contracts. Namely stock index options & futures, single stock options & single stock futures. As a result volume can go through the roof on these days.
As previously mentioned we are also entering the toughest two weeks of the year in terms of stock market performance, the final half of June being particularly bearish. Likely to do with closing positions before the summer lull, it is always psychological. Despite this, the market is so far putting seasonality on its head with big tech FAANG names in particular rearing up. Apple (AAPL) has been downtrodden since results but Facebook (FB) and Amazon (AMZN) have been gearing up for a push to record highs and Apple has recently broken out of the triangle formation-see here.
S&P 500 (ES) forecast
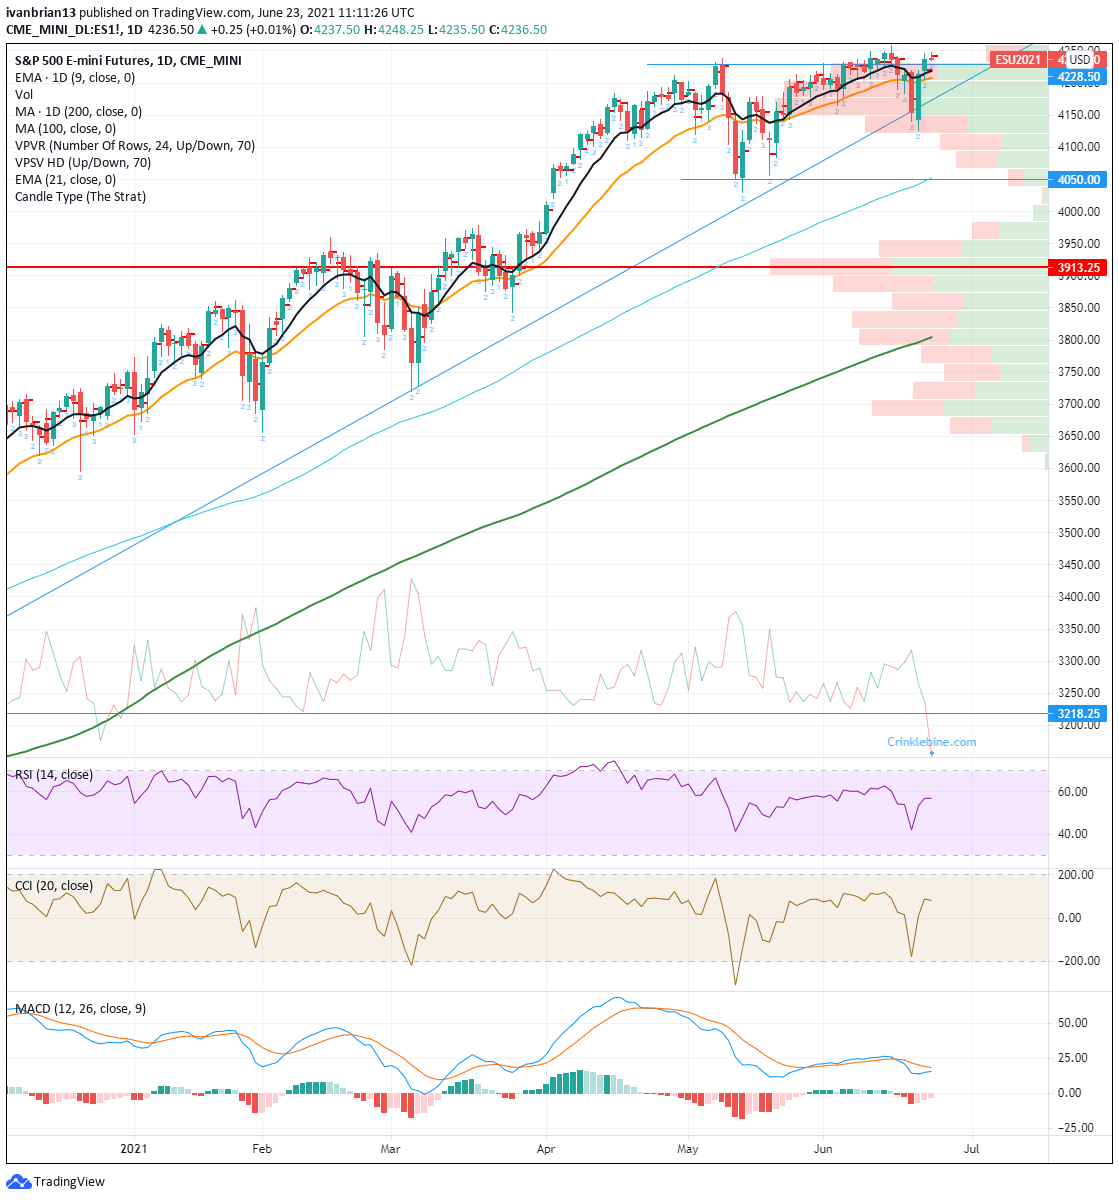
The bullish trend remains in place. For those looking at candle reversal patterns, Mondays was a beauty. A weak start led to a red candle but as the session progressed a flip to green and a powerful close nearly led to a bullish engulfing candle, but still a strong reversal signal. Added to this was the recapturing of the 9 and 21-day moving averages as well as a bounce from the lower trendline in play since October 2020. So all in all a strong support zone. Tuesday's action was a little more cloudy, a green candle to continue the bullish trend and remaining above the 9 and 21-day moving averages throughout the session. However, the point of control (area with highest volume) was toward the lower end of the candle. Just a quick aside, the point of control is the price at which there is the greatest volume but the VWAP is the volume-weighted average price, not the same thing.
Key supports remain at 4228, 4220 from the 9-day MA and 4180 now from the October trendline. A break of 4050 will see a volume vacuum acceleration toward 3950 in all likelihood. The trend is still bullish, the risk-reward still favours the upside but only just and trading is becoming choppy. Use, as ever, good risk management.
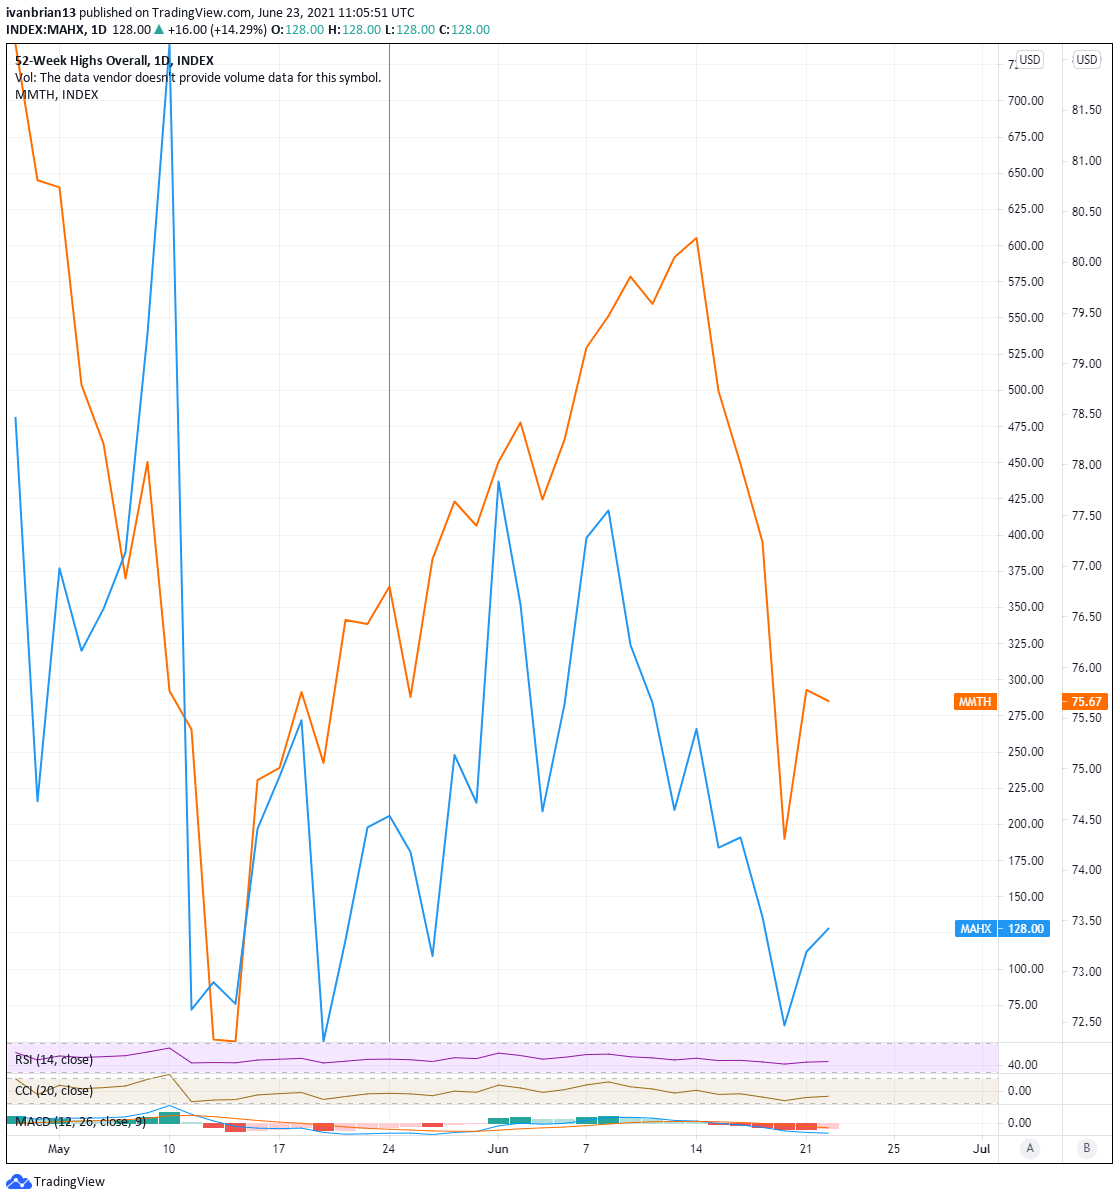
The market breadth remains questionable with the number of stocks making new highs continuing to diminish from early May highs and the number of stocks trading above their 200-day moving average also following a similar trend lower, see chart below
Like this article? Help us with some feedback by answering this survey: