Back
24 Jan 2022
USD/TRY Price Analysis: Finally shifting gears beyond key resistance
- USD/TRY is now starting to make a move to the upside.
- The bulls will be looking for a break of prior highs for the sessions ahead.
The price of USD/TRY has been consolidating for the entire month above the 21-day moving average and capped below a significant area of resistance:
USD/TRY daily chart
-637786481181166325.png)
However, the bulls are taking control as they take on the first layer of resistance as follows:
-637786486308103759.png)
The M-formation is a reversion pattern and the price has broken the neckline resistance at 13.4241 which would now be expected to act as support. Given the turmoil in markets and probabilities of escalation of tensions in Central Asia, the US dollar's bias is to the upside:
DXY daily chart
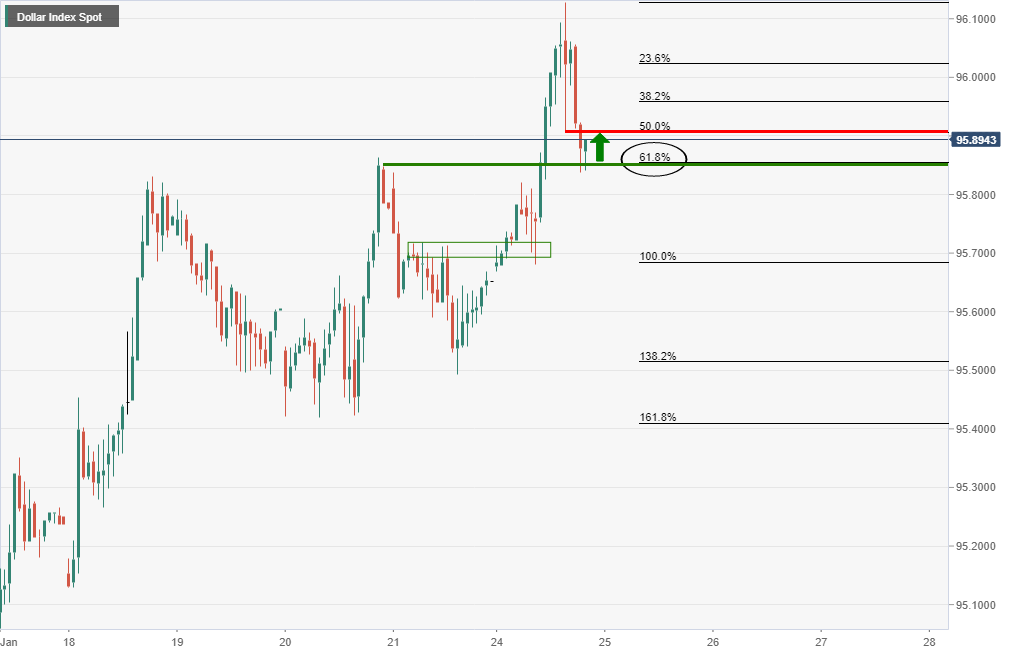
The US dollar, as measured vs a basket of major currencies in the DXY index, has been testing the 61.8% ratio that meets with prior highs as a firm layer of potential support for the sessions ahead.